Axis My India - India Consumer Sentiment Index
Jan 24
  • Overall household spending has increased for 58% of families
  • Essentials like personal care & household items see increased spending from 48% of families, a 5 percentage point rise from last month
  • 13% of families have increased their spending on non-essential & discretionary products
  • Health-related expenses have surged for 40% of families
  • Media consumption remains stable for 22% of families
  • 18% of respondents plan to splurge on luxury items during the festive season, while 79% opt for budget-friendly choices
  • 14% of respondents are entering the New Year with financial resolutions
  • Video Streaming Platform/OTT viewership data reveals varied content preferences across different age groups, with specific interests in comedy, long-form, and short-form videos
  • 65% of respondents acknowledge improvements in road conditions in the last ten years
  • 72% of the respondents perceive improvements in public transportation
  • Post the Jal Jeevan Mission implementation, 65% of the respondents now have access to clean drinking water
  • 77% of the respondents recognise progress in rural electrification post the launch of Pradhan Mantri Sahaj Bijli Har Ghar Yojana – SAUBHAGYA,
  • 70% of respondents note improvements in healthcare facilities following the Ayushman Bharat - PMJAY scheme

Axis My India, a leader in consumer data analytics, presents compelling findings from the latest India Consumer Sentiment Index (CSI) that underscore the dynamic shifts in media consumption patterns across Indian households. The data reveals a nuanced change in media engagement, with a slight increase in families consuming various media forms like TV, Internet, and Radio. In the rapidly evolving digital era, marked by the widespread use of smartphones and affordable internet, there is a noticeable shift towards streaming platforms. 25% of respondents are moving away from traditional cable or satellite subscriptions, embracing the flexibility of digital streaming services. However, traditional media retains its relevance, with 40% of respondents still preferring cable subscriptions, illustrating the coexistence of traditional and digital media formats. The survey further delves into diverse content preferences across different platforms and age groups, highlighting varied interests in serials, movies, sports, and both long and short-form videos.

The January net CSI score, calculated by percentage increase minus percentage decrease in sentiment, is at +10.3, which is an increase of +0.3 from the last month.

The sentiment analysis delves into five relevant sub-indices – Overall household spending, spending on essential and non-essential items, spending on healthcare, media consumption habits, entertainment & tourism trends.

The survey used Computer -Aided Telephonic Interviews and included 4603 participants from 35 states and UTs. Among them, 70% were from rural areas and 30% from urban areas. In terms of regions, 25% were from the North, 27% from the East, 31% from the West, and 17% from the South of India. Among the participants, 59% were male and 41% were female. Looking at the largest groups, 28% were aged between 36 and 50 years old, while 27% were aged between 26 and 35 years old.

Commenting on the CSI report, Pradeep Gupta, Chairman & MD, Axis My India, said, "It is clear we're at the dawn of a new era in how content is consumed. The rise of smartphones and accessible internet has ushered in a shift towards streaming platforms, with a significant portion of audiences embracing this new mode of engagement. Yet, importantly, traditional cable remains a steadfast choice for many, suggesting a diverse and multifaceted media landscape. This blend of new and old, from serials to movies, and sports to varied video formats, reveals a rich tapestry of consumer preferences that transcend age groups and traditional norms. Looking ahead, these insights point to a future where media consumption is not about choosing between digital and traditional, but rather about how these mediums can coexist and complement each other.
Key Findings

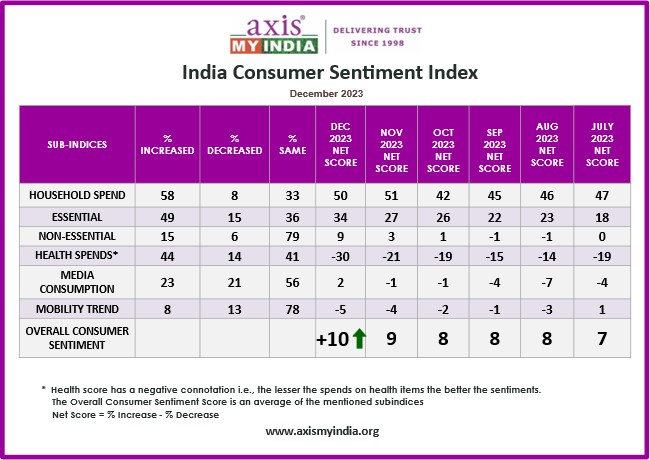
  • Overall household spending has increased for 58% of the families. Consumption remains the same for 35% of families. The net score is +50 which is the same as last month.
  • Spends on essentials like personal care & household items have increased for 48% of families. Consumption remains the same for 39% of families. The net score is at +34 this month.
  • Spends on non-essential & discretionary products like AC, Car, and Refrigerators have increased for 13% of families. Consumption remains the same for 81% of families. The net score, which was +9 last month, is at +6 this month.
  • Expenses towards health-related items such as vitamins, tests, and healthy food have surged for 40% of the families. Consumption remains the same for 46% of families. The health score which has a negative connotation i.e., the lesser the spends on health items the better the sentiments, has a net score value of -26 this month.
  • Consumption of media (TV, Internet, Radio, etc.) has increased for 22% of families which is an decrease by 1% from last month. The net score, which was +2 last month, is at +3 this month.
  • Mobility has increased for 7% of the families. The net score, which was -5 last month, is at -6 this month. Mobility remains the same for 80% of the families.

On topics of current national interest:

  • The advent of the New Year traditionally inspires a flurry of resolutions, with financial goals often topping the list for many. The latest survey data presents an intriguing narrative with 14% of respondents set to ring in the New Year with financial resolutions, pointing to a select group focused on reshaping their fiscal habits. 83% of the respondents will step into the New Year without financial resolutions, suggesting a satisfaction with their existing financial strategies. This divergence in financial forward-planning underscores the varied approaches to personal finance as a new calendar year unfolds.
  • The New Year often serves as a catalyst for financial introspection, a time when many choose to focus on tax planning and investment reviews. In the spirit of fresh starts, a dedicated 14% of the respondents are proactive in their approach and engage in specific financial planning activities such as tax planning and investment reviews. 84% of the respondents do not indulge to participate in these financial planning activities implying a confidence in their ongoing financial strategies or a preference for a less seasonal approach to financial management. This landscape of financial activity highlights a population that values both planned financial recalibration and steadfast financial continuity.
  • The landscape of media consumption has significantly shifted in the wake of widespread smartphone use and affordable internet access. As streaming platforms gain momentum, fuelled by the digital revolution, 25% of respondents have pivoted away from traditional cable or satellite subscriptions, opting instead for the on-demand convenience of digital streaming services. Despite this trend, a notable 40% of the respondents continue to engage with media through the conventional route of cable subscriptions. This persistence of traditional media consumption alongside the rise of streaming highlights the coexistence of old and new media paradigms, reflecting a diverse consumer base with varied preferences and habits in the digital age.
  • The survey explored the intricate landscape of content consumption across TV and Video Streaming Platforms/OTT, revealing diverse viewer preferences:
    • Serials on TV are favoured by 19% of the respondents
    • Movies are watched on TV by 20% of respondents, with another 20% of the respondents enjoying them on both TV and video streaming platforms/OTT
    • Sports content is equally popular on both mediums, with 22% of respondents tuning into both TV and video streaming platforms/OTT
    • Long-form videos or content on video streaming platforms are the choice for 16% of respondents.
    • Short-form videos or content on video streaming platforms attract 22% of respondents.
    • This diverse breakdown underscores a significant shift in media consumption habits, with digital platforms gaining prominence.
    • In examining TV viewership data, distinct patterns in content consumption become evident across various age groups:
      • For TV serials, 19% of respondents aged 36-50, and 51-60 engage in watching, while a slightly higher 21% of the respondents of those above 60 years tune into these shows
      • When it comes to watching movies on TV, 21% of the respondents of 18-25 age group are viewers, closely followed by 20% in both the 26-35 and 36-50 age brackets. The 51-60 age group is not far behind, with 19% indulging in movies on TV.
      • As for sports viewing on TV, 18% of the respondents of 18-25 age group are keen watchers, while the interest slightly increases to 19% among the 26-35 age group, and notably, 21% of respondents above 60 years also actively tune in to watch sports
    • The findings of Video Streaming Platform/OTT viewership data reveals varied content preferences across different age groups:
      • In the comedy genre, 16% of respondents aged 51-56 show a preference for video streaming platforms/OTT
      • For long-form videos/content, there is a consistent interest among multiple age groups: 17% of respondents aged 18-25, 36-50, and above 60 years lean towards video streaming platforms/OTT. Similarly, 16% of those aged 36-50 also prefer these platforms for such content
      • When it comes to short-form videos/content, the highest preference is seen in the 36-50 age group with 24% favouring video streaming platforms/OTT. Close behind are respondents above 60 years at 23%, followed by 22% each in the 18-25 and 26-35 age brackets, and 20% in the 51-60 age group.
    • In the last ten years, the Modi government has made significant strides in prioritising the development and quality of India's road infrastructure, aiming to transform connectivity across the nation. Reflective of these efforts, a substantial 65% of respondents acknowledge noticeable improvements in road conditions since 2014, suggesting that the investments and initiatives in this area have resonated positively with the public.
    • Over the last decade, there has been a notable focus on improving public transportation systems in India. This focus on improving accessibility and efficiency is reflected in recent survey findings, where a substantial 72% of respondents have perceived an improvement in public transport. This significant majority suggests that the initiatives to overhaul and update public transportation facilities and services have positively influenced the general public.
    • Following the implementation of the Jal Jeevan Mission, a significant initiative aiming to provide 55 liters of water per day to every rural Indian household, there has been a notable impact on water accessibility. According to the survey data, 65% of respondents now have access to clean drinking water in their localities, illustrating the positive effect of this ambitious scheme.
    • The launch of Pradhan Mantri Sahaj Bijli Har Ghar Yojana – SAUBHAGYA in 2017 marked a pivotal step towards electrification in India, with 8 states achieving 100% saturation in household electrification. According to the survey findings, 77% of respondents acknowledge significant progress in rural electrification.
    • The Ayushman Bharat - Pradhan Mantri Jan Arogya Yojana (PMJAY), targeting healthcare insurance provision to the poor and lower middle-income groups, has been a significant initiative in India. According to the survey findings, 70% of respondents have observed an improvement in healthcare facilities in their area. This points towards a progressive shift in healthcare accessibility and quality, marking a promising step forward in the nation's healthcare journey.
Dec 23
  • 49% of families have increased spending on essential items
  • Non-essential product spending has risen for 15% of families
  • 44% of households have increased their health-related expenses
  • Media consumption remains stable for 23% of families
  • Financial upliftment in 2023 compared to 2022 is felt by 46% of respondents
  • Consumer spending patterns show 49% leaning towards mobile phone investments, 30% interested in personal mobility, notably two-wheelers.
  • 60% of respondents see Prime Minister Narendra Modi as 2023's most influential figure
  • Chandrayaan-3 lunar mission is identified as the year's defining milestone by 54% of respondents, with its success and record 8.06 million concurrent live stream views highlighting India's space exploration achievements
  • 67% watched exit polls of the state elections
  • Ayushman Bharat - Jan Arogya Yojana awareness is at 27%,
  • 28% are both aware and enrolled in Ayushman Bharat - Jan Arogya Yojana
  • 84% of respondents are not aware of the 14-digit Ayushman Bharat Health Account (ABHA) card

Axis My India, a leading consumer data intelligence company, reveals the latest insights into shifting media consumption habits in India. The survey highlights a notable 23% families report media consumption, resulting in a 3% increase from last month. Focusing on the ICC World Cup 2023 viewership, the study exposes diverse preferences, with 31% opting for traditional television and a significant 22% choosing the mode of mobile phones. The analysis of daily time allocation on media presents a clear trend toward digital platforms, especially for shorter durations, indicating a dynamic transformation in media consumption patterns. Axis My India's findings offer a comprehensive view of the evolving media landscape, influencing the future of consumer behavior in India.

The December net CSI score, calculated by percentage increase minus percentage decrease in sentiment, is at +9.9, which is an increase of +0.9 from the last month.

The sentiment analysis delves into five relevant sub-indices – Overall household spending, spending on essential and non-essential items, spending on healthcare, media consumption habits, entertainment & tourism trends.

The survey used Computer-Aided Telephonic Interviews and included 5,143 participants from 35 states and UTs. Among them, 72% were from rural areas and 28% from urban areas. In terms of regions, 23% were from the North, 24% from the East, 28% from the West, and 25% from the South of India. Among the participants, 60% were male and 40% were female. Looking at the largest groups, 30% were aged between 36 and 50 years old, while 25% were aged between 26 and 35 years old

Commenting on the CSI report, Pradeep Gupta, Chairman & MD, Axis My India, said, "As we analyse the recent trends in India's economic landscape, the subtle yet significant transformations in consumer behavior and spending emerges distinctly. The evolving spending habits reveal a fascinating dynamic of necessity versus aspiration in consumer behavior. We are seeing a nuanced evolution in how households manage their finances and what they prioritise. From embracing digital technology to rethinking financial strategies, the Indian consumer is navigating an ever-changing economic environment with adaptability and foresight. The adaptability to govt schemes also highlights the govt’s role in spreading awareness towards their initiatives as an extension of their contribution to the nation. This trend is a reflection of the current economic and political climate, but is also a crucial indicator for the retail industry, signaling shifting consumer priorities and guiding future market strategies"

Key Findings

  • Overall household spending has increased for 58% of the families, which is a decrease by 2% from last month. Consumption remains the same for 33% of families. The net score, which was +51 last month, has dipped to +50 this month.
  • Spends on essentials like personal care & household items have increased for 49% of families, which marks an increase by 5% from last month. Consumption remains the same for 36% of families. The net score, which was at +27 last month, has surged to +34 this month.
  • Spends on non-essential & discretionary products like AC, Car, and Refrigerators have increased for 15% of families. Consumption remains the same for 79% of families. The net score, which was +3 last month, is at +9 this month.
  • Expenses towards health-related items such as vitamins, tests, and healthy food have surged for 44% of the families, which marks an increase by 7% from last month. Consumption remains the same for 41% of families. The health score which has a negative connotation i.e., the lesser the spends on health items the better the sentiments, has a net score value of -30 this month.
  • Consumption of media (TV, Internet, Radio, etc.) has increased for 23% of families which is an increase by 3% from last month. The net score, which was -1 last month, is at +2 this month.
  • Mobility has increased for 8% of the families, which is a increase of 1% from last month. The net score, which was -4 last month, is at -5 this month. Mobility remains the same for 78% of the families.

On topics of current national interest:

  • The survey provided insightful data on household income, spending, and consumption patterns bringing to light a spectrum of sentiments regarding the nation's economic conditions this year. 46% of the participants expressed a sense of financial upliftment in 2023 compared to 2022 terms of financial well-being. Meanwhile, 36% still hold 2022 in higher regard, feeling that the previous year offered better financial stability. Additionally, 18% of the respondents viewed 2023 as being on par with the previous year, indicating a sense of consistency in their financial experiences.
  • The survey offered valuable insights into the spending patterns of consumers over the past and upcoming six months, highlighting shifts in purchase priorities. According to the findings, a significant 49% of respondent s are leaning towards investing in mobile phones, signalling a strong inclination towards technology and connectivity. Following closely, 37% of the respondents are focusing on financial prudence, with choosing a bank account being a top priority, reflecting an increased awareness and emphasis on financial management. Additionally, personal mobility emerges as a significant factor, with 30% of the respondents showing a preference for acquiring two-wheelers, underlining the growing importance of personal transportation in daily life.
  • In the wake of BJP's notable victories in recent state elections, the survey tapped into the public's perception of influence in India's political sphere. Reflecting on this political landscape, 60% of the respondents identified Prime Minister Narendra Modi as the most influential figure of 2023. This perception has been further bolstered by the Prime Minister's active international engagements, including his pivotal role in the G20 summit and efforts towards elevating India's presence on the global stage. These events have clearly struck a chord with many people, contributing to the increased recognition of Narendra Modi as a significant influencer this year.
  • The survey delved into identifying the top milestone missions for India in a year filled with significant events, including the ICC World Cup and the G20 Summit. A significant 54% of respondents identified the Chandrayaan-3 lunar mission as the most defining milestone of the year. This sentiment is underscored by the remarkable success of Chandrayaan-3, India's ambitious lunar mission. The event not only garnered widespread acclaim and also set a new record with 8.06 million concurrent views during its live stream, highlighting the nation's growing prowess and interest in space exploration and scientific achievements.
  • The survey unveiled that a significant 62% of respondents watched the ICC World Cup 2023, showcasing the event's wide-reaching appeal. Delving deeper into the modes of viewership, it was found that 31% of the respondents followed the matches on television, while a notable 22% of the respondents opted to watch the games on their mobile phones, highlighting the diverse ways in which audiences are consuming sports content in the digital age.
  • The study delved into the average daily time spent on TV and Video Streaming Platforms/OTT across various time brackets. The overall time spent on TV is 65 minutes per day compared to 61 minutes on OTT. The younger age group spend significantly higher time spent on OTT (96 minutes per day) compared to TV (60 minutes per day)
    • For those allocating less than 30 minutes, 14% of respondents reported spending their time on TV, while 15% preferred Video Streaming Platforms/OTT
    • In the 30 minutes to 1-hour category, 16% indicated TV usage compared to 13% for Video Streaming Platforms/OTT
    • Moving on to the 1-2 hour bracket, 24% opted for TV, while 18% chose Video Streaming Platforms/OTT
    • The percentages decrease for longer durations, with 10% on TV and 9% on Video Streaming Platforms/OTT for 3-4 hours
    • 2% on TV and 3% on Video Streaming Platforms/OTT for 5-8 hours, and
    • Merely 1% for both TV and Video Streaming Platforms/OTT for 9 or more hours
    • This breakdown illustrates the varying preferences in media consumption habits, emphasizing a notable shift towards digital platforms, especially for shorter durations.
    • Expanding on the findings regarding age-wise distribution, the data from Axis My India provides insights into the percentage of individuals within different age groups who spend ‘1-2 hours’ watching TV on a typical day:
    • 23% of 18-25 age group dedicate this time to TV
    • 21% of 26-35 age group dedicate this time to TV
    • 27% of 36-50 age group dedicate this time to TV
    • 26% of 51-60 age group dedicate this time to TV
    • 25% of above 60 age group dedicate this time to TV
    • This suggests a fairly even distribution of TV watching habits across different age groups, with a slightly higher inclination in the 36-50 age category.
    • Examining the data on a typical day's OTT viewership, distinct patterns emerge across various age groups:
    • Among individuals aged 18-25, a notable 25% engage with OTT platforms,
    • Slightly lower yet significant 24% from the 26-35 age group do the same.
    • The prevalence decreases in the 36-50 age group, with 17% of individuals choosing OTT for their media consumption.
    • Further down the age spectrum, the 51-60 age group and those above 60 exhibit similar preferences, with 12% from both demographics tuning into OTT platforms
  • These findings highlight the varying degrees of adoption of OTT platforms across different age brackets, indicating a higher affinity among younger individuals for on-demand streaming services. This suggests a fairly even distribution of TV watching habits across different age groups, with a slightly higher inclination in the 36-50 age category.
  • The survey shed light on public awareness and participation in the Ayushman Bharat - Jan Arogya Yojana, a pivotal health insurance scheme by the Government of India. It was revealed that 27% of respondents are aware of the scheme but have not taken the step to enroll. This indicates a significant level of awareness about the scheme, yet highlights a gap between awareness and action. On the other hand, 28% of respondents are aware of the scheme and have actively enrolled in the scheme, suggesting a proactive approach towards availing the health benefits offered.
  • The survey provided insights into the public's awareness and adoption of the 14-digit Ayushman Bharat Health Account (ABHA) card, a key component of India's health digitisation efforts. It revealed that 84% of respondents, are unaware of the ABHA card, indicating a significant knowledge gap in this critical health initiative. This suggests a considerable gap in public knowledge regarding the ABHA and its benefits. On the other hand, 9% of respondents have actively obtained the ABHA card, indicating some level of engagement and uptake among the populace. Meanwhile, 7% of respondents, although aware of the ABHA, do not possess the card.
  • With the five state elections seen as a prelude to the 2024 Lok Sabha elections the December CSI Report highlights the keen interest among the public in political trends. A significant 67% of respondents had expressed their intent to watch the exit polls of these crucial state elections, indicating a high level of engagement and curiosity about the potential outcomes and their implications. In contrast, 32% of the surveyed population are not planning to tune in for the exit polls, suggesting varying levels of political interest and engagement across the public.
Nov 23
  • 57% Tune into mobile streaming app for ICC ODI Cricket World Cup 2023 - Axis My India November CSI Survey
  • Oppo Ads Score Big with 16% of respondents Recalling Their Promotions
  • 57% of viewers are tuning in on Hotstar, while 49% use Linear TV/DTH to watch the ICC ODI Cricket World Cup 2023, 8% are watching it on Connected TVs
  • 67% of respondents plan to watch the final ICC ODI World Cup matches
  • Oppo, Thums Up, Mahindra, Havells, Dream 11 are the top recalled brands on ICC ODI World Cup

Axis My India, a leading consumer data intelligence company, has unveiled the latest insights from the India Consumer Sentiment Index (CSI), shedding light on significant media consumption trends. With the ICC ODI Cricket World Cup 2023 in full throttle and India dominating, overall 67% plan to watch the matches. A whopping 57% are flocking to online mobile streaming platforms such as Hotstar for live action, while 49% is hooked to their Linear Television sets, 8% are watching it on Connected TVs. Oppo, Thums Up, Mahindra, Havells, Dream 11 are the top recalled brands on ICC ODI World Cup. The report also notes that 20% of families are broadening their media horizons, with platforms such as TV, Internet, and Radio. Interestingly, consumption across these platforms remains consistent, showing no change from last month's figures.

The November net CSI score, calculated by percentage increase minus percentage decrease in sentiment, is at +9, which is an increase of +1 from the last 2 months.

The sentiment analysis delves into five relevant sub-indices – Overall household spending, spending on essential and non-essential items, spending on healthcare, media consumption habits, entertainment & tourism trends.

The survey used Computer-Aided Telephonic Interviews and included 4,980 participants from 35 states and UTs. Among them, 69% were from rural areas and 31% from urban areas. In terms of regions, 23% were from the North, 25% from the East, 28% from the West, and 23% from the South of India. Among the participants, 65% were male and 35% were female. Looking at the largest groups, 34% were aged between 36 and 50 years old, while 27% were aged between 26 and 35 years old

Commenting on the CSI report, Pradeep Gupta, Chairman & MD, Axis My India, said, "As the pulse of the ICC ODI Cricket World Cup 2023 quickens, India's enthusiasm resonates across both fields and screens. While a significant portion of fans eagerly tune in for the critical matches, we are seeing a blend of modern and traditional viewing preferences. Digital platforms are commanding attention, yet the charm of conventional cable/DTH remains unshaken. Interestingly, amidst the cricketing showdown, advertisements continue to play their own game of capturing viewer attention. This amalgamation of viewership patterns and advertising impact offers a compelling insight into a nation deeply invested in the sport, both on and off the pitch."
Key Findings

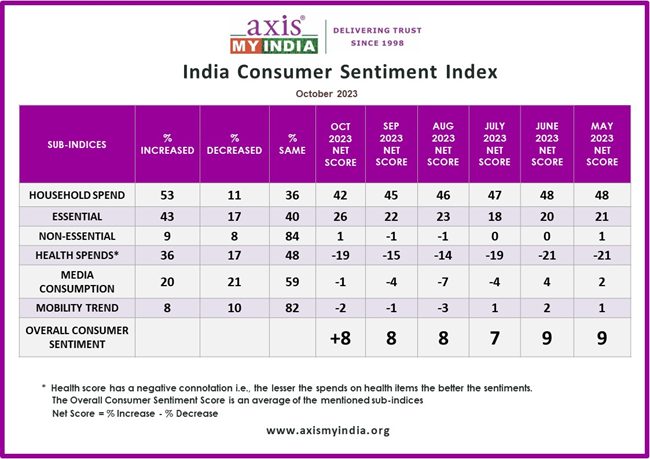
  • Consumption of media (TV, Internet, Radio, etc.) has increased for 20% of families which is the same as last month. The net score, which was -1 last month, also remains the same.
  • Overall household spending has increased for 60% of the families, which is an increase by 7% from last month. Consumption remains the same for 31% of families. The net score, which was +42 last month, has increased to +51 this month.
  • Spends on essentials like personal care & household items have increased for 44% of families, which marks an increase by 1% from last month. Consumption remains the same for 40% of families. The net score, which was at +26 last month, has surged to +27 this month.
  • Spends on non-essential & discretionary products like AC, Car, and Refrigerators have increased for 8% of families. Consumption remains the same for 86% of families. The net score, which was +1 last month, is at +3 this month.
  • Expenses towards health-related items such as vitamins, tests, and healthy food have surged for 37% of the families, which marks an increase by 1% from last month. Consumption remains the same for 48% of families. The health score which has a negative connotation i.e., the lesser the spends on health items the better the sentiments, has a net score value of -21 this month.
  • Mobility has increased for 7% of the families, which is a decrease of 1% from last month. The net score, which was -2 last month, is at -4 this month. Mobility remains the same for 82% of the families.

On topics of current national interest:

  • In the ICC ODI Cricket World Cup 2023, with the Indian team leading the table over 67% plan to watch the matches. Out of them, 26% of the respondents intend to tune in for the crucial final games of the current season. Meanwhile, 22% of respondents are following matches played by their preferred team, and 19% of respondents are watching almost every game of the season.
  • During the ICC ODI Cricket World Cup 2023, various viewing platforms have gained traction among audiences. The survey reveals that a dominant 57% of respondents are catching the action live online mobile streaming platforms such as Hotstar. Traditional cable/DTH television still holds its ground with 49% of respondents tuning in through this medium. Notably, emerging technology isn't left behind, with 8% of enthusiasts streaming the matches on connected television sets using devices such as Fire Stick TV, Chromecast, and similar platforms.
  • During the ICC ODI Cricket World Cup 2023, advertisements played a pivotal role in capturing viewer attention amidst the on-field action. According to the survey, mobile phone brand Oppo made a significant impression, with 16% of respondents recalling their advertisement the most. Close on its heels, 13% each have recognised advertisements from brands like MRF, Thums Up, Pepsi, Coca-Cola, and Havells. Additionally, Dream11, a fantasy sports platform, also managed to engage the audience effectively, with 12% of respondents recalling their promotional content.
  • The survey delved into consumers intentions regarding their shopping preferences during the upcoming festive season. Notably, 25% of the respondents are enthusiastic about shopping more as compared to last year while 23% are committed to sustaining their purchase levels as last year.
  • The survey provided insights into household shopping budgets for the forthcoming festivities. A notable 56% of respondents are set to shop a budget of less than Rs 5000, while 24% plan to shop in the range of Rs. 5,000 - Rs. 10,000. Furthermore, 11% of the respondents are looking to spend between Rs. 10,000 - Rs. 20,000, while a combined segment of 7% is gearing up for shopping sprees ranging from Rs. 20,000 to a lavish Rs. 2,00,000. A significant 1% of overall population plan to spend more than Rs. 2,00,000.
  • During the auspicious festive occasions, the spectrum of consumer purchases is broad and varied. It encompasses the customary on clothing and apparel but also extends to high-value items. These items range from the latest electronic gadgets, such as mobile phones, to indispensable home appliances, and even luxury investments like vehicles, real estate, and jewellery. A significant majority of 67% of respondents, indicated their intent to shop for clothes/apparel. Furthermore, 13% of the respondents have their eyes on a new mobile phone, while a noteworthy 12% of the respondents are aiming to enhance their homes with appliances such as ACs, TVs, washing machines, refrigerators, and more. 5% plan to buy a 4-wheeler.
  • The survey explored the preferences of participants concerning various shopping channels they prefer when purchasing festive items. A significant 82% of respondents voiced a preference for local physical retail stores near home indicating a potent sentiment towards bolstering local enterprises. On another note, 10% of the respondents leaned towards online shopping platforms for their festive acquisitions. Meanwhile, 8% of respondents expressed favour for brand-specific physical stores, highlighting a range of diverse shopping inclinations among consumers.
  • Festive shopping popularised by e-commerce platforms has emerged as a significant favourite, especially with the advent of special promotions. These themes have become increasingly popular among consumers. According to the survey, a noteworthy 22% of respondents have expressed their intention to actively participate and make purchases during these e-commerce-led shopping festivals.
  • In the vibrant landscape of festive shopping, payment preferences reflected a blend of tradition and modernity. Amid the festive hustle and bustle, a substantial 79% of respondents gravitate towards the timeless charm of cash for their transactions. In a modern twist, 16% of respondents are inclined to embrace digital wallets to settle their festive purchases, while 5% opt for the convenience of debit/credit cards and online banking for transactions.
  • Diwali, often hailed as the festival of prosperity and wealth, brings with it the added delight of financial bonuses for many. Employers often mark the occasion by distributing salary bonuses, allowing employees to indulge in the festive spirit with a little extra in their wallets. According to the survey, a notable 19% of respondents have received /are anticipating receiving a salary bonus due to Diwali celebrations.
Oct 23
  • 5,452 people surveyed; 66% are from rural India while 34% are from urban India
  • Overall household spending increased for 53% (2% decrease from last month)
  • Essential spending increased for 43% (2% increase from last month) and non-essential spends increased for 9% (3% spike from last month)
  • Health spends surged for 36%, up by 2%
  • 55% prioritize spending on food and groceries, 37% on clothing and accessories, during festive season
  • 43% value product quality as primary during festive purchases, followed by 21% focusing on discounts
  • 62% favour local outlets for home decor, 58% for food and groceries, and 53% for clothing

Axis My India, a leading consumer data intelligence company, unveils the latest insights from the India Consumer Sentiment Index (CSI), revealing noteworthy trends in consumer behaviour. The report showcases a diverse range of data, such an increase in overall household spending for 53% of families, highlighting a nuanced 2% dip from the last month. Additionally, the festive spirit seems to be in full swing, as 55% of respondents plan to prioritize spending on festive delights, from food and groceries to clothing and accessories. Significantly, 43% of shoppers spotlight product quality as their foremost consideration, indicating a discerning and quality-conscious consumer base. The report also celebrates the enduring appeal of local markets, with 56% of participants favouring them, echoing the "vocal for local" ethos. With the festive season ushering in renowned sales events and diverse shopping experiences, the findings provide a vibrant and optimistic outlook for businesses and consumers alike.

The October net CSI score, calculated by percentage increase minus percentage decrease in sentiment, is at +8, which is the same as compared to last 2 months.

The sentiment analysis delves into five relevant sub-indices – Overall household spending, spending on essential and non-essential items, spending on healthcare, media consumption habits, entertainment & tourism trends.

The survey used Computer-Aided Telephonic Interviews and included 5452 participants from 35 states and UTs. Among them, 66% were from rural areas and 34% from urban areas. In terms of regions, 32% were from the North, 20% from the East, 39% from the West, and 9% from the South of India. Among the participants, 64% were male and 36% were female. Looking at the largest groups, 29% were aged between 36 and 50 years old, while 28% were aged between 26 and 35 years old.

Commenting on the CSI report, Pradeep Gupta, Chairman & MD, Axis My India, said, "As we navigate through this festive season consumers are showcasing a harmonious blend of traditional values and modern preferences. As we enter this festive season, it is evident that quality and local sourcing remain paramount, yet the digital realm is undeniably shaping purchasing decisions. Brands that understand this synergy and can cater to both aspects will undoubtedly thrive. Furthermore, the survey insights reveal an undying commitment to supporting local businesses, echoing the spirit of self-reliance and the 'vocal for local' ethos. The commitment to local vendors and businesses emphasizes a deep-rooted sense of community and reflects a collective effort to foster and support local ecosystems. We see a conscientious shift towards responsible consumerism, where the emphasis is equally on the source as it is on the quality of the purchase. The consumer today is informed, engaged, and values-centric, shaping a transformative era in retail that is rich in trust, quality, digital savviness, and a deeply rooted community spirit."
Key Findings

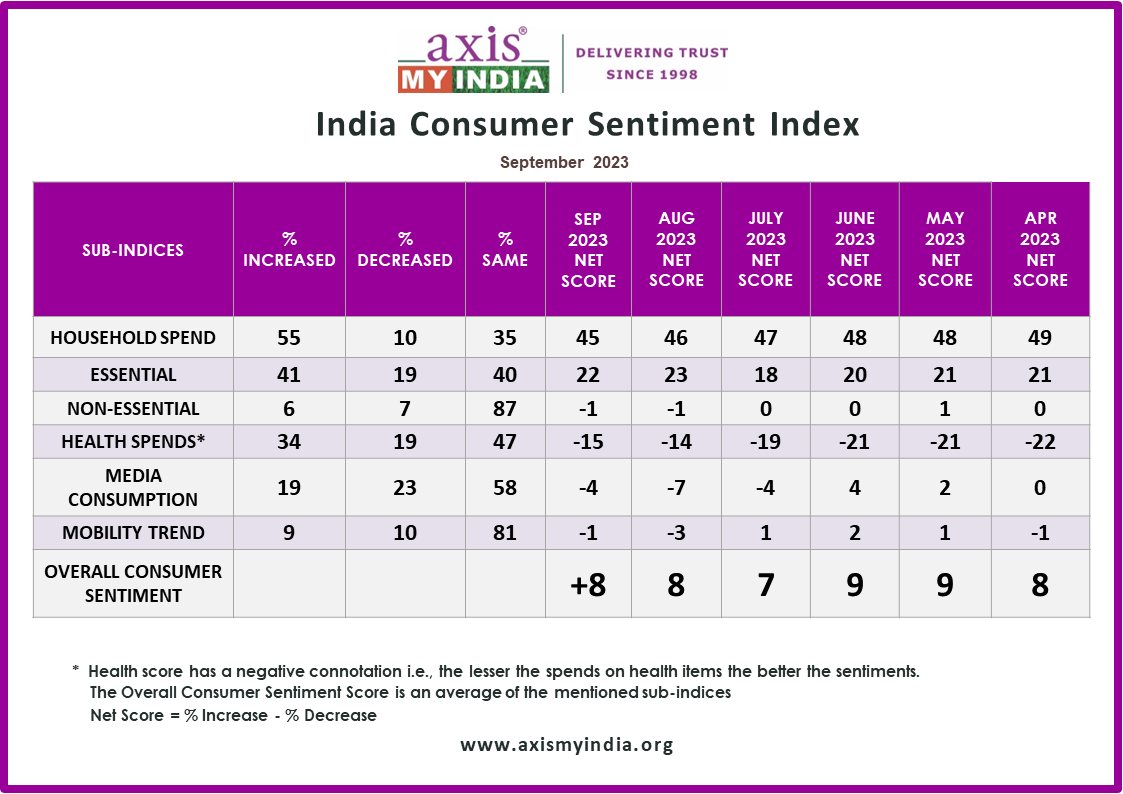
  • Overall household spending has increased for 53% of the families, which is a decrease by 2% from last month. Consumption remains the same for 36% of families. The net score, which was +45 last month, has dipped to +42 this month.
  • Spends on essentials like personal care & household items have increased for 43% of families, which marks an increase by 2% from last month. Consumption remains the same for 40% of families. The net score, which was at 22 last month, has surged to +26 this month.
  • Spends on non-essential & discretionary products like AC, Car, and Refrigerators have increased for 9% of families, which reflects a spike from last month by 3%. Consumption remains the same for 84% of families. The net score, which was -1 last month, is at +1 this month.
  • Expenses towards health-related items such as vitamins, tests, healthy food has surged for 36% of the families. This reflects an increase in consumption by 2% from last month. Consumption remains the same for 48% of families. The health score which has a negative connotation i.e., the lesser the spends on health items the better the sentiments, has a net score value of -19 this month.
  • Consumption of media (TV, Internet, Radio, etc.) has increased for 20% of families, depicting a slight increase in media consumption percentage by 1% from last month. The net score, which was -4 last month, is at -1 this month. Media consumption remains the same for 59% of families.
  • Mobility has increased for 8% of the families, which is a dip by 1% from last month. The net score, which was -1 last month, has dipped to -2 this month. Mobility remains the same for 82% of the families.

On topics of current national interest:

  • The survey delved into consumers intentions regarding their shopping preferences for the upcoming festive season. Notably, 55% of respondents plan to prioritize spending on food and groceries. Moreover, 37% of respondents indicated a desire to spend on clothing and accessories. The rest are leaning towards allocating their expenditures on home décor and furnishings, electronics, and gadgets, as well as discretionary items like cars, ACs, and refrigerators. These insights underscore potential shifts in consumer patterns and their anticipated repercussions on the market.
  • The survey thoroughly explored various factors and determinants that shape the respondents purchasing choices during the festive period. Remarkably, a prominent 43% of respondent indicated that product quality is the primary factor guiding their buying choices during the festive period. Meanwhile, 21% of respondents mentioned that discounts and promotions substantially sway their purchasing decisions during these times. On the other hand, 16% of respondents recognized personal preferences as the leading factor in their festive buying choices.
  • Participants place a high value on product quality, highlighting its importance above other considerations such as discounts, brand reputation, and personal preferences when shopping. A commendable 48% of participants prioritize product quality when investing in durable goods like cars, ACs, and refrigerators. Similarly, an encouraging 44% and 43% of participants seek top-quality products in the realms of food and groceries, and clothing and accessories, respectively. Furthermore, 42% and 38% of participants champion product quality as a key factor when choosing home decor and furnishing, as well as electronics and gadgets. This underlines a positive trend toward informed and quality-conscious buying choices.
  • The survey delved into participants inclinations regarding different shopping channels they prefer when purchasing festive items. A significant 56% of respondents expressed a preference for local markets and vendors, reflecting a strong inclination towards supporting local businesses. Interestingly, a modest 36% of respondents showed a preference for in-branded physical stores for their festive shopping. Meanwhile, 8% of respondents favoured e-commerce platforms for their festive purchases, showcasing the diversity in shopping preferences.
  • Echoing the spirit of self-reliance, respondents demonstrated a commendable preference for shopping from local markets and vendors, championing the "vocal for local" ethos. A remarkable 62% of participants choose local outlets for their home décor and furnishing needs. Similarly, 58% of participants opt for local sources for their food and grocery shopping, while 53% of participants look locally for clothing and accessories. Notably, even for more substantial discretionary purchases like cars, ACs, and refrigerators, a significant 39% of participants still favour in-store shopping. This showcases a strong community-focused consumer trend.
  • The survey delved into participants perspectives on big ticket spending during the festive season. Interestingly 77% of participants are opting to refrain from making any big-ticket purchases during this festive time. On the other hand, 18% of participants are demonstrating a willingness to engage in significant spending, showcasing a sense of optimism and economic resilience. Meanwhile, 4% of participants are still contemplating their spending decisions, reflecting a sense of careful consideration during the festive season.
  • In the vibrant landscape of festive shopping, payment preferences reflected a blend of tradition and modernity. Amid the festive hustle and bustle, a substantial 78% of respondents gravitate towards the timeless charm of cash for their transactions. In a modern twist, 16% of respondents are inclined to embrace digital wallets to settle their festive purchases, while an innovative 6% of respondents opt for the convenience of debit/credit cards and online banking for their seasonal transactions. These eclectic payment preferences underscore the harmonious blend of tradition and innovation in the festive shopping experience.
  • The survey explored the preferred channels through which participants stay updated on festive promotions and discounts. 34% of participants stay updated through social media ads, showcasing the growing influence of digital platforms. Additionally, 32% of participants trust word-of-mouth, reflecting the enduring value of personal recommendations. Interestingly, a modest 12% of participants choose newspapers as their source of information on festive offers and deals, indicating a diverse range of preferred mediums.
  • Social media ads emerge as a highly effective channel, with a significant majority leveraging them to stay abreast of festive deals and offers, showcasing the growing influence of digital platforms in today's festive market. 50% of respondents rely on social media advertisements for updates on offers related to electronics and gadgets. Similarly, 42% and 41% of respondents tap into these ads for offers on discretionary spends and home decor. 36% of respondents stay updated on festive offers and deals for clothing and accessories through social media ads, emphasizing the platform's significance. Interestingly, traditional word-of-mouth still holds sway for 35% of respondents, particularly when it comes to food and groceries, emphasizing the blend of digital and traditional in today's market dynamics.
  • The 84-day festival season joyfully welcomes renowned sales events such as Amazon's Great Indian Festival and Flipkart's Big Billion Day, enticing shoppers to delight in making high- value purchases during this celebratory period. 20% of participants hold off for these exceptional sales to benefit from the abundant discounts and offers available. Meanwhile, 71% of participants stick to their regular spending habits, unaffected by the festive season's sales and promotions. Furthermore, an opportunistic 9% of participants make substantial purchases, contingent on the appealing discounts presented during the festive season sales. All in all, the festive season not only lights up our spirits but also opens a gateway to smart, joyous shopping experiences for everyone.
  • The festive season presents an excellent opportunity for brands and businesses to forge deeper connections, fostering meaningful conversations with their customers. 33% of respondents are more likely to interact with brands when presented with compelling offers. While 39% of respondents cherish the classic touch, choosing not to interact with brands on social media for festive deals, a mere 22% of respondents abstain from leveraging social media for their online shopping needs, showcasing the enduring charm of classic approaches.
  • As the festive season unveils its charm, participants' interactions with brands on social media paint an intriguing picture. In the radiant tapestry of festive season engagements, 42% of participants choose to keep their experiences with brand deals close to their heart, refraining from broadcasting them on social media. On the brighter side, 23% of participants show a budding interest in sharing their brand interactions, while an enthusiastic 10% of participants are eager to highlight their festive finds on social media. This diversity in sharing exemplifies the varied yet vibrant ways in which people choose to celebrate their festive shopping journeys.
Sep 23
  • 5,048 people surveyed; 68% are from rural India while 32% are from urban India
  • Overall household spends increased for 55% increased (3% decrease from last month)
  • Essential Spends increased for 41% and non-essential spends increased for 6%
  • spends surged for 34%, up by 1%
  • 28% to maintain spending, during festive season
  • 11% of 34% will be first time online shoppers
  • 6% intend to invest more in the stock market while, 5% plans to maintain
  • 46% of investors optimistic about SENSEX crossing 70,000
  • 64% showcase confidence on government policies
  • 70% aware of the ODI World Cup

Axis My India, a leading consumer data intelligence company, unveils the latest insights from the India Consumer Sentiment Index (CSI), revealing noteworthy trends in consumer behavior. The report showcases a diverse range of data, such as the 3% decrease in overall household spending for this month compared to the previous month. Notably, 23% of respondents are anticipating increased shopping activities during the upcoming festive season, reflecting a positive sentiment towards holiday spending. Additionally, 44% of those intending to maintain their pattern of participation in e-commerce festive sales this year plan to spend more than last year. These numeric insights provide a quantitative backdrop to the evolving consumer landscape, guiding market strategies for the festive period.

The September net CSI score, calculated by percentage increase minus percentage decrease in sentiment, is at +8, which is same as last month (+8). However, the score reflects a dip of -2 from last year September 2022 (+10)

The sentiment analysis delves into five relevant sub-indices – Overall household spending, spending on essential and non-essential items, spending on healthcare, media consumption habits, entertainment & tourism trends.

The survey used Computer-Aided Telephonic Interviews and included 5048 participants from 35 states and UTs. Among them, 68% were from rural areas and 32% from urban areas. In terms of regions, 22% were from the North, 24% from the East, 28% from the West, and 26% from the South of India. Among the participants, 62% were male and 38% were female. Looking at the largest groups, 29% were aged between 36 and 50 years old, while 27% were aged between 26 and 35 years old

Commenting on the CSI report, Pradeep Gupta, Chairman & MD, Axis My India, said, "As we approach the festive season, our insights paint an encouraging picture for the retail landscape. A significant number of respondents are ready to elevate their shopping experiences, while others are poised to maintain their spending levels. E-commerce continues to play a pivotal role, with an increasing interest in festive online sales. This evolving trend suggests a promising market dynamic. As consumer preferences shape the retail arena, we anticipate a vibrant festive shopping spree ahead, reflecting a positive and forward-looking trend."
Key Findings

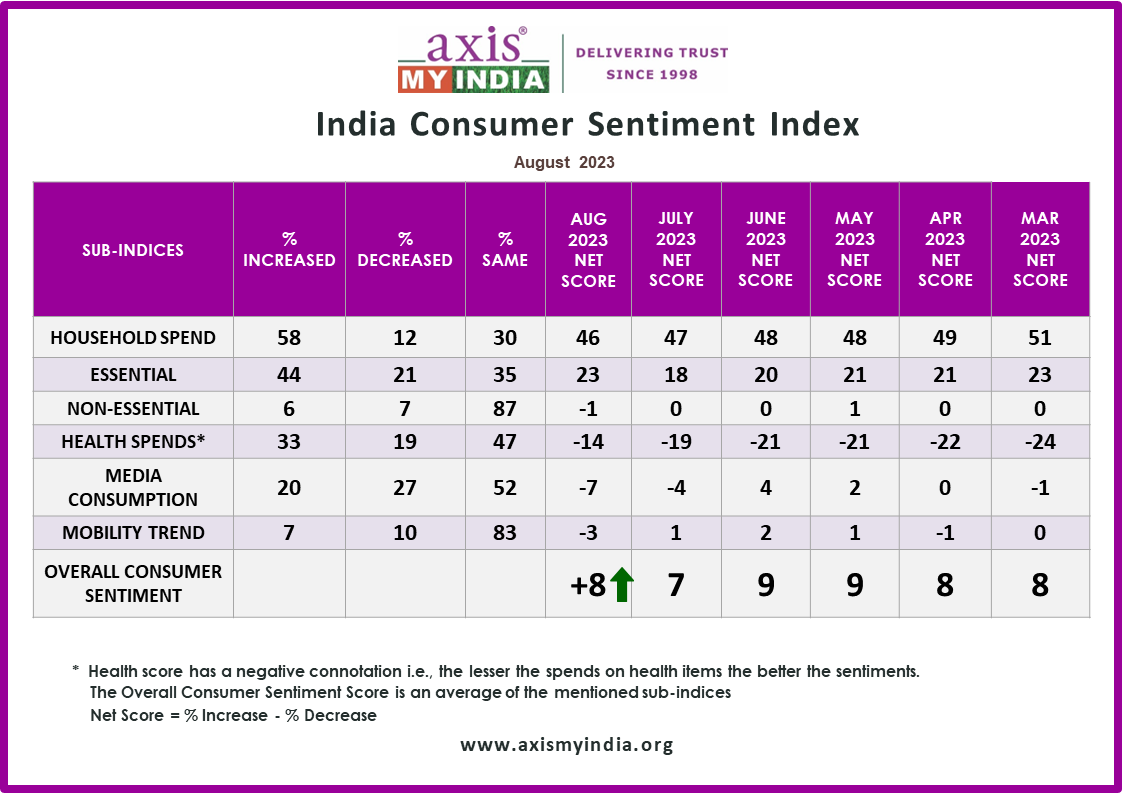
  • Overall household spending has increased for 55% of the families, which is a decrease by 3% from last month. Consumption remains the same for 35% of families. The net score, which was +46 last month is +45 this month.
  • Spends on essentials like personal care & household items have increased for 41% of families, which marks a decrease by 3% from last month. Consumption remains the same for 40% of families. The net score, which was at +23 last month has dipped to +22 this month.
  • Spends on non-essential & discretionary products like AC, Car, and Refrigerators have increased for 6% of families, which is the same as last month. Consumption remains the same for 87% of families. The net score, which was 0 last month is at -1 this month.
  • Expenses towards health-related items such as vitamins, tests, healthy food has surged for 34% of the families. This reflects an increase in consumption by 1% from last month. Consumption remains the same for 47% of families. The health score which has a negative connotation i.e., the lesser the spends on health items the better the sentiments, has a net score value of -15 this month.
  • Consumption of media (TV, Internet, Radio, etc.) has increased for 19% of families, depicting a decrease in media consumption percentage by 1% from last month. The net score, which was -7 last month is at -4 this month. Media consumption remains the same for 58% of families.
  • Mobility has increased for 9% of the families, which is an increase by 2% from last month. The net score, which was -2 last month has improved to -1 this month. Mobility remains the same for 81% of the families.

On topics of current national interest:

  • The survey delved into consumers intentions regarding their shopping preferences for the upcoming festive season. Notably, 23% of respondents plan to shop more during the festive period as compared to last year. Additionally, 28% of participants revealed their intention to maintain their spending habits at the same level as before, hinting at a stable consumer sentiment. These responses highlight the potential shifts in consumer behavior and their possible impact on the market.
  • The survey explored respondents prior and potential involvement in festive sales organized by e-commerce giants like Amazon and Flipkart. Significantly, a notable 23% of participants confirmed their past participation in such events and expressed their intent to maintain this pattern this year as well. Additionally, 11% of those who had not engaged in festive online sales before expressed their interest in participating this year. Conversely, 7% acknowledged their previous engagement but revealed their decision not to partake this year.
  • Of 23% of those who intent to maintain the pattern this year, 44% said they will be shopping more through e-commerce mediums as compared to last year. These insights provide a comprehensive understanding of consumers' past and evolving attitudes towards e-commerce festive sales, shaping strategies for these platforms.
  • The survey explored participants inclinations towards investment in the Indian stock market or other financial assets in the upcoming months. Notably, a mere 6% expressed an intention to invest more, while 10% indicated plans to invest less. Meanwhile, 5% are projected to maintain their investment levels. These insights provide a snapshot of the current sentiment towards financial market investments, emphasizing the diverse attitudes among the surveyed individuals. Notably, a significant 79% still don’t invest in stocks.
  • The survey inquired about participants' perceptions regarding the potential movement of the stock exchange (SENSEX) beyond the threshold of 70,000 before the festive period of Dussherra/Diwali this year. Encouragingly, 46% of respondents who invested expressed optimism that such a milestone could be achieved. Furthermore, 8% were uncertain about the market's trajectory. These findings underscore the diverse range of opinions prevalent among respondents, reflecting the complex and multifaceted nature of stock market predictions.
  • The survey delved into participants' perspectives on the government's economic policies and their perceived influence on the nation's growth. Impressively, 64% of respondents expressed a confidence in the effectiveness of policies such as Pradhan Mantri Jan Dhan Yojana and Pradhan Mantri Mudra Yojana.
  • The survey inquired about respondents awareness of the forthcoming 2023 ODI World Cup being hosted in India. Encouragingly, 70% of participants confirmed their awareness of this prestigious sporting event taking place in the country. It highlights the fact that a substantial majority of respondents are cognizant of the global cricket event's occurrence on Indian soil, reinforcing the event's prominence and reach among the surveyed audience.
  • The survey sought to ascertain respondents' preferences regarding their anticipated viewing platforms for the upcoming 2023 ODI World Cup set to unfold in India. The findings reflect a diverse array of choices. Notably, 47% of respondents expressed their intention to tune in via traditional television, utilizing DTH or cable services. Demonstrating the increasing influence of digital trends, 27% indicated their inclination to follow the event on their mobile devices. A notable 9% exhibited enthusiasm to experience the tournament live by planning to attend matches at the stadium. These preferences underscore the multi-faceted avenues through which individuals are gearing up to engage with the international cricket spectacle, embracing both traditional and contemporary viewing modes.
Aug 23
  • 70% watch TV shows daily, 64% read newspapers daily
  • 5,092 people surveyed; 65% are from rural India while 35% are from urban India
  • Media consumption increased for 20%
  • 70% of respondents reported watching TV shows daily, indicating that television remains a popular medium for entertainment
  • 64% of respondents read newspapers daily, indicating that traditional print media remains relevant despite the digital age.
  • 80% of respondents reported watching video content on platforms like YouTube, Instagram reels, Facebook shorts, etc., daily.
  • 47% watch OTT shows daily, 49% of respondents still listen to the radio, 45% of respondents reported visiting movie halls less than once a month

National, 3rd August 2023:, Axis My India, a leading consumer data intelligence company, has unveiled its latest report on the India Consumer Sentiment Index (CSI), providing invaluable insights into evolving media consumption patterns, consumer behaviour, and data privacy sentiments. The survey shows the final balance between Television media consumption and Online Video Content Consumption both dominating as primary mode of entertainment. Moreover, the report reveal trends in movie theatre visits, OTT consumption and Radio consumption. With data-driven observations and comprehensive analysis, this report serves as a crucial resource for businesses seeking to align their marketing strategies with changing consumer preferences in the digital age.: Axis My India, a leading consumer data intelligence company, has unveiled its latest report on the India Consumer Sentiment Index (CSI), providing invaluable insights into evolving media consumption patterns, consumer behaviour, and data privacy sentiments. The survey shows the change in media consumption, particularly among younger demographics, with TV News Channels and Social Media dominating as primary news sources. Moreover, the report reveals intriguing trends in movie theatre visits, online shopping habits, and preferred sources of product information. With data-driven observations and comprehensive analysis, this report serves as a crucial resource for businesses seeking to align their marketing strategies with changing consumer preferences in the digital age. The August net CSI score, calculated by percentage increase minus percentage decrease in sentiment, is at +8, which has increased as compared to last month (+7). The sentiment analysis delves into five relevant sub-indices – Overall household spending, spending on essential and non-essential items, spending on healthcare, media consumption habits, entertainment & tourism trends.

The survey was carried out, via Computer-Aided Telephonic Interviews with a sample size of 5092 people across 35 states and UTs. 65% belonged to rural India, while 35% belonged to urban counterparts. In terms of regional spread, 22% belong to the Northern parts while 25% belong to the Eastern parts of India. Moreover, 28% and 26% belonged to Western and Southern parts of India respectively. 61% of the respondents were male, while 39% were female. In terms of the two majority sample groups, 31% each reflect the age group of 36YO to 50YO and the age group 26YO to 35YO.

Commenting on the CSI report, Pradeep Gupta, Chairman & MD, Axis My India, said, "The media consumption landscape is continuously evolving, revealing intriguing trends that promise a transformative future for content engagement. Digital platforms are experiencing remarkable growth, driven by tech-savvy youth, while traditional mediums like TV and newspapers retain their allure. Noteworthy is the renaissance of cinema, spearheaded by urbanites and seniors. Looking ahead, digital media's dominance is set to soar further, with online video content and OTT shows captivating millions daily. Yet, radio's enduring relevance endorses its appeal in the digitally-driven era. Businesses must adapt to these evolving preferences, crafting tailored experiences to thrive in the ever-expanding universe of media choices."
Key Findings

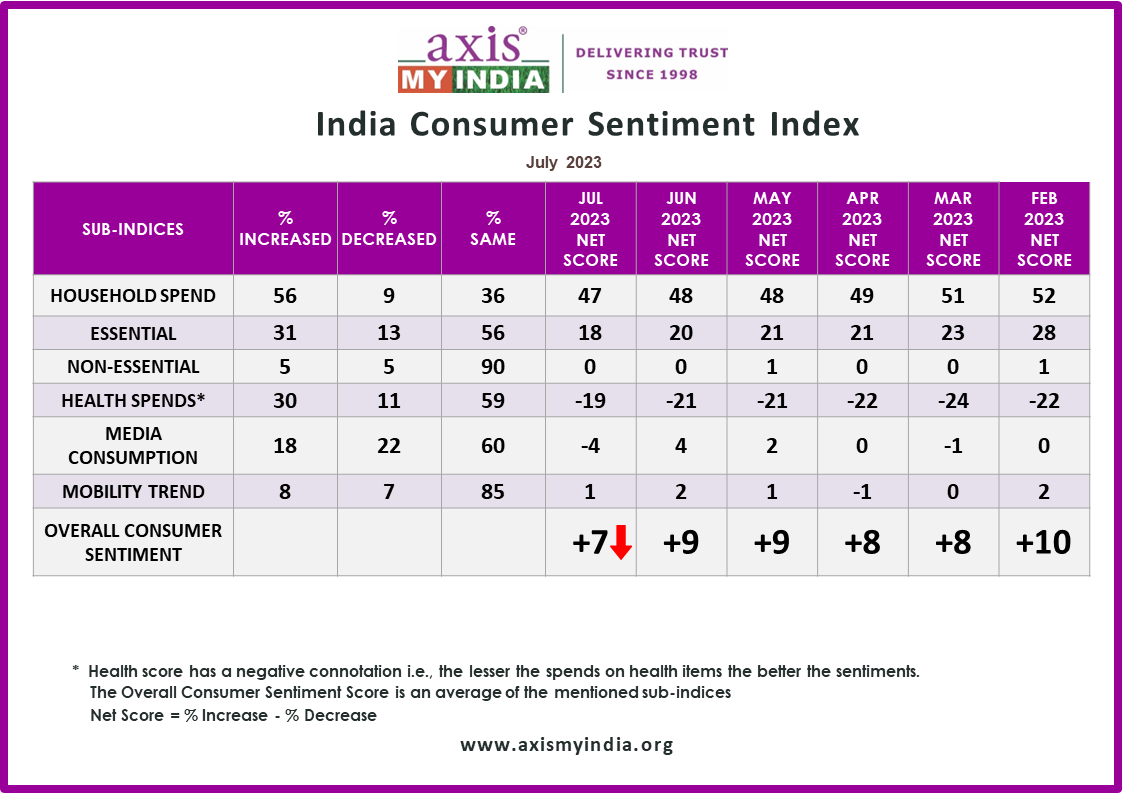
  • Overall household spending has increased for 58% of the families, which is an increase by 2% from last two months and the highest increase in the last five months. The net score, which was +48 last month is +46 this month. The increase is slightly higher in the southern states such as Andhra Pradesh (71% each) followed by Telangana (67%), and Karnataka (65%).
  • Spends on essentials like personal care & household items have increased for 44% of families, which marks a significant increase by 13% from last month and the highest in the last five months. The net score, which was at +18 last month has surged to +23 this month which is the highest in the last five months. Essential spending reflects an increase majorly for the southern states such as Telangana (67%) Andhra Pradesh (63%) and Tamil Nadu (61%).
  • Spends on non-essential & discretionary products like AC, Car, and Refrigerators have increased for 6% of families, which is an increase by 1% from last month. Discretionary spending reflects an increase majorly for the states of Meghalaya (17%), New Delhi (13%), and Odisha and Tamil Nadu (11% each).
  • Expenses towards health-related items such as vitamins, tests, healthy food has surged for 33% of the families. This reflects an increase in consumption by 3% from last month. The health score which has a negative connotation i.e., the lesser the spends on health items the better the sentiments, has a net score value -14 this month. Health-related products consumption increased more for the states of Punjab (44%), Rajasthan and Chhattisgarh (42% each).
  • Consumption of media (TV, Internet, Radio etc.) has increased for 20% of families, depicting an increase in media consumption percentage by 2% from last month. This increase is depicted after a decrease was reflected last month at 18%.
  • Mobility has increased for 7% of the families, which is a dip by 1% from last month. Mobility is highest amongst the states of Tamil Nadu (24%), Arunachal Pradesh (14%) and Rajasthan (12%)

On topics of current national interest:

  • Axis My India CSI survey aimed to understand content consumption trends among consumers. The survey covered various mediums, including television, newspapers, online video content, radio, and movie halls.
    • Television Consumption: 70% of respondents reported watching TV shows daily, with 87% watching it atleast once a week, indicating that television remains a popular medium for entertainment. Regions like Northeast, Karnataka, Gujarat and Delhi recorded the highest percentage of respondents with 'everyday' consumption habits. This highlights the popularity of television in these regions.
    • Newspaper Consumption: 64% of respondents read newspapers daily, indicating that traditional print media remains relevant despite the digital age. 15% of respondents read newspapers once or twice a week, showcasing a smaller but noteworthy group of occasional readers. Regions such as Karnataka, Kerala, Madhya Pradesh, and West Bengal showed the highest percentage of 'everyday' newspaper readers, suggesting strong newspaper readership in these areas.
    • Online Video Content Consumption: 80% of respondents reported watching video content on platforms like YouTube, Instagram reels, Facebook shorts, etc., daily. This shows the significant impact of digital media on content consumption. 47% of respondents reported watching Over-The-Top (OTT) shows daily, reflecting the growing popularity of on-demand streaming services.
    • Daily OTT Consumption: 47% watch OTT shows daily. Respondents from regions like Chhattisgarh, Gujarat, Haryana, and West Bengal reported the highest daily consumption of OTT content. This shows the growing popularity of on-demand streaming services in these areas.
    • Radio Consumption: Despite the rise of digital media, 49% of respondents still listen to the radio, highlighting its continued relevance and reach.
    • Movie Halls: 45% of respondents reported visiting movie halls less than once a month, indicating a decline in physical movie-going habits, possibly due to the availability of digital streaming platforms.
  • In terms of spending motivations among consumers across different product categories, the survey findings revealed the top four areas where consumers plan to increase their expenses, these include health-related items (Ointments, medicines, bandages, etc), view of 31%; household items (food/drinks/grocery), view of 28%; home improvement, view of 23%; and on clothing, view of 22%.
  • The survey further sought consumer responses on the products and services they either bought in the last 6 months or plan to purchase in the next 6 months.
    • Bought in the last 6 months - The results revealed that 3% of respondents bought a 4-wheeler (Sedan, SUV, Mini) in the last 6 months, 7% of respondents purchased a 2-wheeler (Scooty, Bike, Electric). 1% of respondents bought a tractor in the last 6 months. Furthermore, 18% of respondents acquired a mobile phone in the last 6 months while 7% of respondents made a purchase in the home appliance category (TV, Fridge, AC) in the last 6 months. Finally, only 7% of respondents bought luxury goods (Watch/Jewelry, items more than Rs. 10,000) in the last 6 months.
    • Planning to Purchase in the next 6 months - In the automotive category, 13% of respondents expressed their intention to purchase a 4-wheeler (Hatch, Sedan, SUV) in the next 6 months, while 15% of respondents plan to buy a 2-wheeler (Scooty, Bike, Electric). Regarding tractors, 6% of respondents are considering purchasing one. On consumer electronics, 17% of respondents are planning to buy a mobile phone in the next 6 months, while 13% intend to purchase home appliances. Finally, in the luxury goods category, 15% of respondents have plans to purchase in the next 6 months.
  • As the festive season approaches, Axis My India surveyed consumers to understand their primary purchasing factors over the next six months. According to the findings, a significant 47% of respondents prioritize quality as their primary purchasing factor, emphasizing their preference for durable and high-quality products. This view mostly resonated with the consumers of Karnataka, Maharashtra, Punjab and Chhattisgarh. Affordability and budget-conscious choices remain essential, with 23% of respondents placing price as their top consideration. Brand equity also plays a role in consumer decisions, as 14% of respondents consider it a crucial factor, indicating trust in established and reputable brands. While though sustainability and environment-friendly options are gaining traction, only 2% of respondents prioritize these aspects in their purchases. Convenience is valued by 11% of respondents, reflecting a preference for easily accessible and time-saving options.
  • Ahead of India's 76th Independence Day, the survey gauged key expectations of citizens from the government. It revealed diverse priorities among respondents. The top two expectations were to bring down inflation, with 46% of respondents emphasizing its importance, and to generate employment opportunities, which garnered 41% of the responses. Additionally, 19% of respondents highlighted the need for better infrastructure, encompassing improvements in schools, hospitals, and roads. Furthermore, 16% of respondents expressed their expectations for the government to address everyday challenges related to food, clothing, shelter, and water. Concerns about farmers' prosperity garnered the attention of 13% of respondents, while 6% stressed the importance of peace and harmony across religions. Border security and strengthening India's global image were each mentioned by 3% and 2% of respondents, respectively.
  • Seeking consumer responses on whether they believe the nation has progressed more in the last 10 years (2013-2023) compared to the 10 years before that (2003-2013), it revealed that 75% of respondents hold the view that the nation has indeed made significant progress in the recent decade. On the other hand, 22% of respondents expressed a contrary opinion, believing that progress has not been substantial in the past 10 years. A smaller proportion, constituting 3% of respondents, expressed the belief that the progress remained relatively unchanged during the two periods under consideration.
July 23
  • 44% view TV News Channels as Most Trusted Source for Latest Updates - as per Axis My India July CSI Survey
  • Social Media Gains Traction among Younger Audiences (23%)
  • 5,072 people surveyed; 67% are from rural India while 33% are from urban India
  • Media consumption increased for 18%, more among males (20%) and 18-25YO (29%)
  • Mobility increased for 8%, highest among 18-25YO (14%)
  • TV News Channels are primary news source for latest updates followed by social media (23%), YouTube (18%), newspapers (14%)
  • 49% visit movie theatres once a month, urban (51%), females (57%)
  • Local Shopkeepers (36%) and internet searches (29%) are primary sources for product information
  • 18-25YO most frequent online shoppers, at least shop once a month (35%)
  • 49% worried about data privacy, 18-35YO most apprehensive

National, 5th July 2023:, Axis My India, a leading consumer data intelligence company, released its latest findings of the India Consumer Sentiment Index (CSI), a monthly analysis of consumer perception on a wide range of issues. The June report reveals intriguing insights into the changing spending patterns and consumer behaviour in India. Notably, overall household spending has remained consistent, with a slight increase in Rural as compared to Urban markets. Furthermore, the survey shed light on consumer preferences for summer durable products like air conditioners (AC) and refrigerators and summer products such as ice creams and beverages, revealing a slightly muted summer. These findings provide valuable insights into the evolving market trends and consumer preferences during the summer season.

(A&M + Public Issue) National, 06th June 2023: Axis My India, a leading consumer data intelligence company, has unveiled its latest report on the India Consumer Sentiment Index (CSI), providing invaluable insights into evolving media consumption patterns, consumer behaviour, and data privacy sentiments. The survey shows the change in media consumption, particularly among younger demographics, with TV News Channels and Social Media dominating as primary news sources. Moreover, the report reveals intriguing trends in movie theatre visits, online shopping habits, and preferred sources of product information. With data-driven observations and comprehensive analysis, this report serves as a crucial resource for businesses seeking to align their marketing strategies with changing consumer preferences in the digital age. The July net CSI score, calculated by percentage increase minus percentage decrease in sentiment, is at +7, which has decreased as compared to last month (+9). The sentiment analysis delves into five relevant sub-indices – Overall household spending, spending on essential and non-essential items, spending on healthcare, media consumption habits, and entertainment & tourism trends.

The survey was carried out via Computer-Aided Telephonic Interviews with a sample size of 5072 people across 35 states and UTs. 67% belonged to rural India, while 33% belonged to urban counterparts. In terms of regional spread, 23% belong to the Northern parts while 22% belong to the Eastern parts of India. Moreover, 26% and 29% belonged to Western and Southern parts of India respectively. 59% of the respondents were male, while 41% were female. In terms of the two majority sample groups, 31% reflect the age group of 36YO to 50YO and 27% reflect the age group 26YO to 35YO.

Commenting on the CSI report, Pradeep Gupta, Chairman & MD, Axis My India, said "Amidst India's ever-changing economic landscape, our comprehensive survey reveals fascinating patterns in media consumption, information seeking, and online shopping habits. Embracing the digital era, the youth drive a surge in digital platform usage, while traditional sources like TV news maintain steadfast relevance. The cinema’s revival is noteworthy, with urbanites and seniors spearheading this trend. Trust remains paramount, as consumers rely on shopkeepers, local markets, and online searches for product insights. However, data privacy concerns loom, particularly among the younger generation. These insightful trends underscore the imperative for a versatile approach to cater to the diverse preferences of our dynamic consumer base."
Key Findings

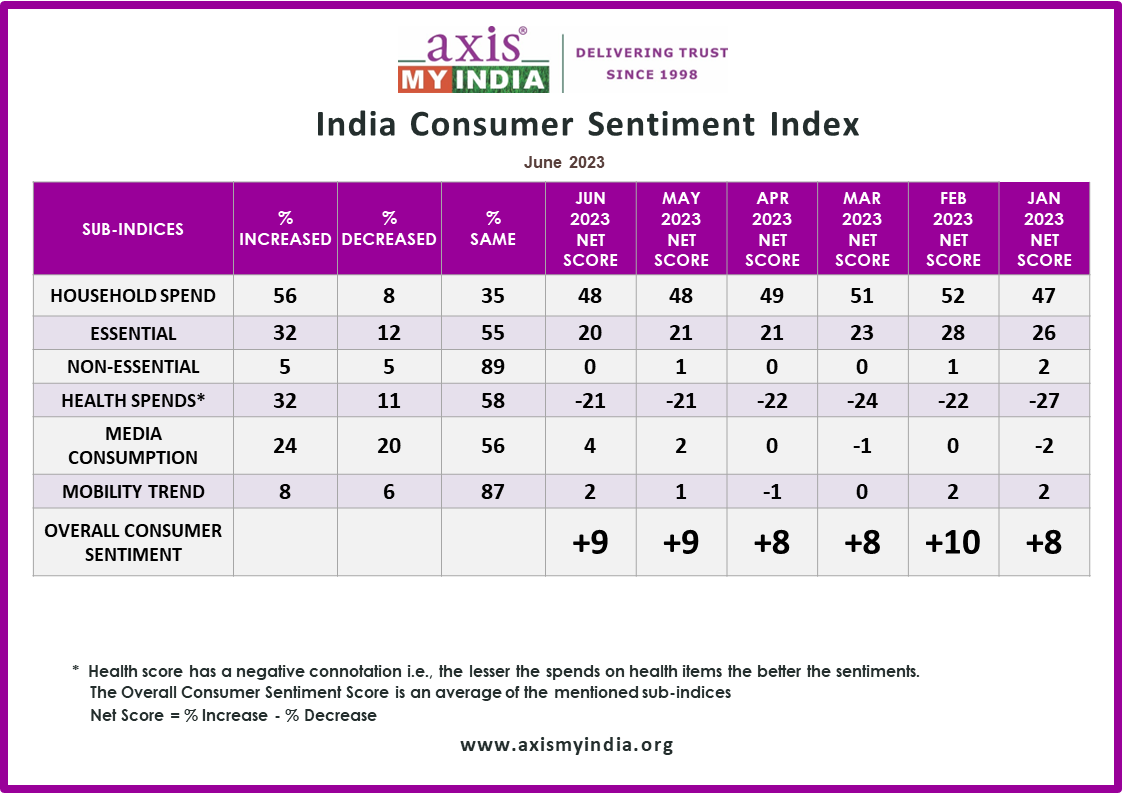
  • Overall household spending has increased for 56% of the families, which is the same as the last two months. The net score, which was +48 last month is +47 this month. The increase is slightly higher in rural households (57%).
  • Spends on essentials like personal care & household items has increased for 31% of the families, which has decreased by 1% from last month. The net score, which was at +20 last month has dipped to +18 this month. Essential spends continue to increase majorly for the rural segment of the consumers (32%) and among 18-25-year-olds (38%).
  • Spends on non-essential & discretionary products like AC, Car, and Refrigerators have increased for 5% of families, which is the same as last two months. The net score is 0, which was same as the last month.
  • Expenses towards health-related items such as vitamins, tests, and healthy food has surged for 30% of families. This reflects a decrease in consumption by 2% from last month. The health score which has a negative connotation i.e., the lesser the spends on health items the better the sentiments, has a net score value -19 this month. Health-related products consumption increased more for the rural segment of the consumers (31%), among females (30%), and among those within the age group of 26-35-year-olds (34%).
  • Consumption of media (TV, Internet, Radio, etc.) has increased for 18% of families, depicting a significant dip in increased media consumption percentage by 6% from last month. This decrease is depicted after an increase was reflected last month at 24% (the highest since April 23) majorly due to IPL. The overall, net score which was at +4 last month is at -4 this month. The increase in Media viewership percentage could be majorly reflected among males (20%) and 18-25 YO (29%) compared to older age groups.
  • Mobility has increased for 8% of the families, which is the same as last month. The overall mobility net indicator score, which was at +2 last month, is at +1 this month. Mobility is highest amongst the age group of 18-25YO at 14% which is 2% more than last month for the same age group.

On topics of current national interest:

  • This month Axis My India CSI survey aimed to understand the primary platform that consumers rely on to stay updated with the latest news. As per the findings, TV News Channels are the primary news source for 44% of respondents, followed by Social Media (23%) and YouTube education/news channels (18%). Newspapers accounted for only 14% of news consumption, while YouTube Shorts had 7%. TV News Channels and Newspapers are preferred majorly by viewers above 60 years while social media platforms and formats are majorly preferred by 18-25YO.
  • Another key aspect explored was the frequency of movie theatre visits in recent months. The findings reveal interesting patterns in consumer behaviour, where in out of all the respondents, 49% stated that they visited movie theatres once a month, 30% twice, 8% thrice, and 13% more than three times. As a significant proportion of consumers visit movie theatres at least once a month, it could be apt to assume that a consistent interest in cinema as a form of entertainment is again rising back. This keenness is majorly witnessed amongst urban consumers (51%), and females (57%).
  • When seeking information about products they intend to buy, respondents in the Axis My India survey relied on various sources. The primary sources of information were shopkeepers and local markets (36%), followed closely by internet searches (29%), indicating the significance of both traditional and digital channels. A notable 19% of respondents preferred seeking advice from friends, colleagues, or neighbours, highlighting the continued influence of word-of-mouth recommendations in purchase decisions. YouTube emerged as a source of product information for 6% of respondents, demonstrating the growing popularity of video content in informing consumer choices and Television advertisements held relevance for 5% of respondents. Only 2% refer to social media, and 1% go directly to the company website or use print media. While those above 60 years old prefer shopkeepers and local markets, 18-25YO prefer internet searches and YouTube videos. The majority of the 51-60YO prefer seeking advice from others.
  • The survey further unveiled a diverse range of online shopping habits among consumers with a sizable portion yet to adopt e-commerce as their preferred mode of shopping. A significant 64% stated they never shop online. However, 11% do online shopping once a month, and 7% do so once in 6 months to 1 year. Additionally, 6% shopped online once in the last 6 months, and another 6% did so more than once in the last month. Only 3% shopped online more than once in the last 6 months, while a mere 2% engaged in online shopping almost every week. 18-25YO forms the majority segment that shops once a month (19%).
  • The survey further gauged respondents’ sentiments regarding data privacy and security in the context of the increasing usage of the internet and technology in their daily lives. The findings reveal that 45% of respondents reported not being worried about data privacy and security, while 23% expressed a significant concern. Additionally, 26% reported being worried to some extent suggesting a moderate level of concern about data privacy and security. They may have a general awareness of the risks involved but may not be overly alarmed by them. A majority of 18-35YO reflect apprehension to a large extent.
  • Finally, the survey also focussed on farmers' concerns about the potential repercussions of sdeficient monsoon on their farming activities in the current year. The findings revealed that 55% of farmers were highly worried, 24% expressed mild concern, 9% were optimistic about a good monsoon, and 13% expected normal monsoons. These findings highlight the apprehensions of a significant portion of farmers, emphasizing the importance of addressing agricultural challenges and potential risks associated with monsoon variability.
June 23
  • (Retail) Consumption of summer products like ice creams & beverages same or lesser for 79% consumers - as per Axis My India June CSI Survey
  • 86% not planning to buy a durable product like AC, Refrigerator this summer
  • (A&M + Public Issue) Evolving OTT Platform Preferences Reshape the Digital Entertainment Landscape as per Axis My India June CSI Survey
  • 37% have subscribed to some form of OTT, Jio Cinema leads with 14% subscribers
  • Growing awareness and acceptance of the LGBTQ+ community rights, particularly among 18-25-year-olds
  • (Economy) 31% confident of India's ability to avoid a recession as per Axis My India June CSI Survey
  • (Tech) 28% of those aware find AI tools enhance workplace productivity as per Axis My India June CSI Survey
  • (HR) 64% of those working in the private sector were unaffected by Job Cuts or Layoffs

Summary

  • 9,657 people surveyed; 68% are from rural India while 32% are from urban India
  • Household spending increased for 56% (net score +48)
  • Spends on essentials increased for 32% (net score +20)
  • Spends on non-essential products increased for 5% (net score 0)
  • Health-related expenses surged for 32% (net score -21)
  • Consumption of media increased for 24% (net score +4)
  • Mobility increased for 8% (net score +2)
  • 31% believe India will not experience an economic recession
  • 36% affected by job cuts & lay off to some extent
  • 4% purchased summer durable products, 9% still planning to buy
  • 21% increased consumption of ice creams and beverages.
  • At an overall level, only 12% aware of AI related tools
  • Of those aware, 26% believe AI tools can replace human jobs
  • Top OTT platforms currently subscribed: Jio Cinema (14%), Hotstar (10%), Amazon Prime (7%), Netflix (4%)
  • Future OTT platform subscriptions: Amazon Prime (22%), Hotstar (22%), Jio Cinema (21%), Netflix (12%)
  • Planning to watch India vs Australia World Test Championship: 24% TV, 19% digital/mobile.
  • 57% support equal marriage rights for same-sex couples

(Retail) National, 06th June 2023: Axis My India, a leading consumer data intelligence company, released its latest findings of the India Consumer Sentiment Index (CSI), a monthly analysis of consumer perception on a wide range of issues. The June report reveals intriguing insights into the changing spending patterns and consumer behaviour in India. Notably, overall household spending has remained consistent, with a slight increase in Rural as compared to Urban markets. Furthermore, the survey shed light on consumer preferences for summer durable products like air conditioners (AC) and refrigerators and summer products such as ice creams and beverages, revealing a slightly muted summer. These findings provide valuable insights into the evolving market trends and consumer preferences during the summer season.

(A&M + Public Issue) National, 06th June 2023 Axis My India, a leading consumer data intelligence company, has released its latest findings of the India Consumer Sentiment Index (CSI), offering valuable insights into the evolving landscape of media consumption and societal attitudes. The report highlights notable trends in media viewership, particularly a significant increase in consumption across various platforms, including TV, Internet, and Radio. Surprisingly, males and the 18-25-year-old age group exhibited the highest growth in media viewership. Additionally, the survey delved into the preferences and subscriptions of Over-The-Top (OTT) platforms, revealing the dominant platforms, such as Hotstar, Jio Cinema, Amazon Prime, and Netflix. The report also shed light on the anticipated viewership of upcoming India vs Australia World Test Championship, with varying levels of interest across TV and digital/mobile platforms. Furthermore, the report unveiled that a significant proportion of respondents showed support for granting equal marriage rights to same-sex couples, reflecting evolving societal attitudes.

(Tech+Economy+HR) National, 06th June 2023 Axis My India, a leading consumer data intelligence company, has released its latest findings of the India Consumer Sentiment Index, shedding light on optimistic consumer perceptions around the economy, employment, and technology adoption. A notable majority has expressed confidence that India will not face an economic recession or just to some extent in 2023, indicating stability for the country's economy. Furthermore, a significant proportion of participants reported being unaffected by job cuts or layoffs which contrasts with some of the global economies. Additionally, the survey highlighted the positive sentiment towards AI-related tools, with respondents acknowledging their ability to reduce workload and save time. These insights signify the growing acceptance and recognition of technology's potential to enhance productivity and efficiency in the workplace. Overall, the survey reflects a prevailing sense of optimism among consumers, with positive sentiments regarding the economy, job stability, and the increasing adoption of AI technologies.

The June net CSI score calculated by percentage increase minus percentage decrease in sentiment, is at +9, which has remained the same as compared to last month.

The sentiment analysis delves into five relevant sub-indices – Overall household spending, spending on essential and non-essential items, spending on healthcare, media consumption habits, entertainment & tourism trends.

The survey was carried out via Computer-Aided Telephonic Interviews with a sample size of 9657 people across 33 states and UTs. 68% belonged to rural India, while 32% belonged to urban counterparts. In terms of regional spread, 30% belong to the Northern parts while 27% belong to the Eastern parts of India. Moreover, 30% and 13% belonged to Western and Southern parts of India respectively. 68% of the respondents were male, while 32% were female. In terms of the two majority sample groups, 30% reflect the age group 26YO to 35YO and 31% reflect the age group of 36YO to 50YO.

(Retail) Commenting on the CSI report, Pradeep Gupta, Chairman & MD, Axis My India, said "Understanding the shifts in consumer spending patterns is crucial in adapting to the evolving market dynamics. Household spends at an overall level has remained consistent, signifying the stability of the Indian economy. Additionally, the slight rise in essential spends for rural consumers underscores the importance of meeting basic needs by the segment and the sustained demand for non-essential and discretionary products highlights the aspirational mindset of the 26-35 age group. The insights from our survey shed light on the cautious approach towards summer season categories, with a significant majority opting to delay their purchase. These shifts in consumer behavior reflect evolving aspirations, changing priorities, and the need for businesses to adapt and cater to their evolving needs."

(A&M + Public Issue) Commenting on the CSI report, Pradeep Gupta, Chairman & MD, Axis My India, said "We have witnessed a significant shift in the preferences and usage patterns of OTT platforms among Indian consumers. The dominance of Jio Cinema and Hotstar as the top two currently subscribed platforms reflects the widespread availability and appeal of these services. The growing popularity of Amazon Prime and the consistent presence of Netflix demonstrate the increasing demand for diverse content offerings. It is intriguing to note the dynamic nature of platform preferences, with Jio Cinema surpassing others as the most widely used platform mainly on the back of IPL. This indicates the evolving landscape of consumer choices and the need for platforms to continuously innovate and cater to changing preferences. As consumers seek more personalized and engaging content experiences, platforms must continue to invest in captivating offerings to retain and attract subscribers. Our study also sheds light on the viewership preferences for the upcoming India vs Australia World Test Championship, highlighting a balanced interest in both traditional TV viewing and digital/mobile platforms. This emphasizes the importance of multi-platform strategies for broadcasting major sporting events to cater to the diverse preferences of consumers."

(Tech+Economy+HR) Commenting on the CSI report, Pradeep Gupta, Chairman & MD, Axis My India, said "The survey underlines positive sentiment among consumers regarding the future of technology, the economy, and the job market. Our findings showcase a slow but growing acceptance and utilization of AI-related tools, offering opportunities to streamline workflows and boost productivity. As we embrace the advancements in technology, businesses can leverage this momentum to foster innovation, create job opportunities, and contribute to the overall economic growth of the country."
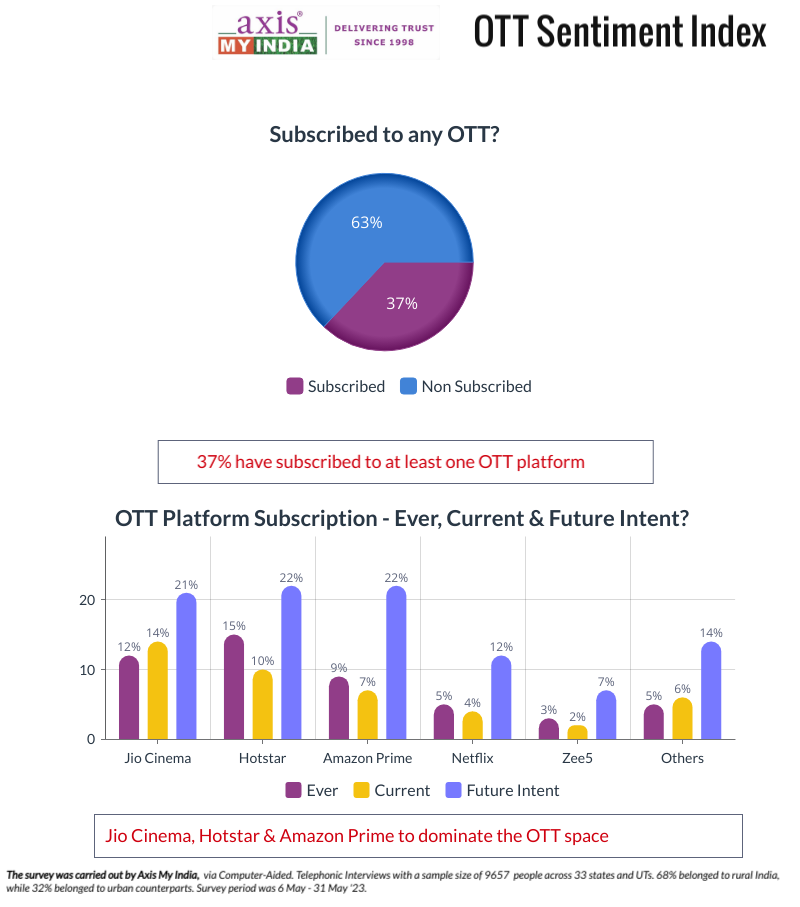
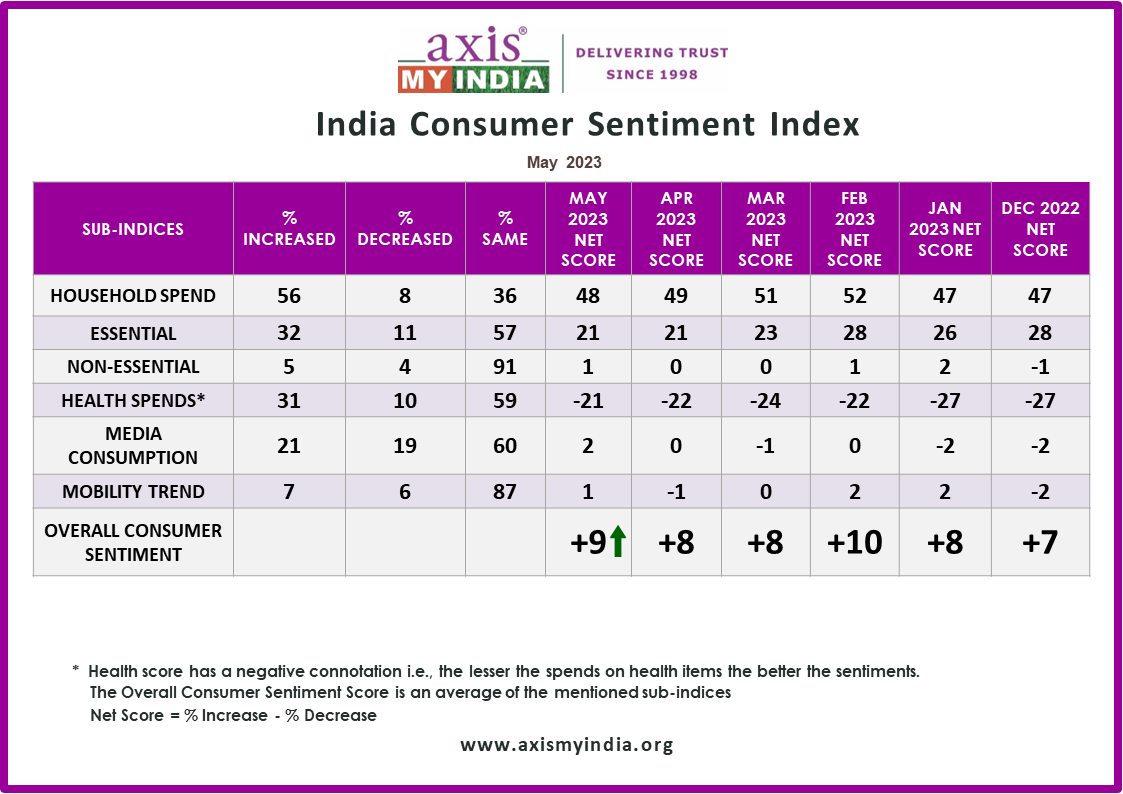
Key Findings

  • Overall household spending has increased for 56% of the families, which is the same as last month. The net score, which was +48 last month remains the same this month. The increase is slightly higher in Urban households.
  • Spends on essentials like personal care & household items has increased for 32% of the families, which is the same as last month. The net score, which was at +21 last month is at +20 this month. Essential spends has increased more for the rural segment of the consumers (34%) as compared to Urban (29%).
  • Spends on non-essential & discretionary products like AC, Car, and Refrigerator have increased for 5% of families, which is the same as last month. The net score, which was at +1 last month, is 0 this month.
  • Expenses towards health-related items such as vitamins, tests, healthy food has surged for 32% of the families. This reflects an increase in consumption by 1% from last month. The health score which has a negative connotation i.e., the lesser the spends on health items the better the sentiments, has a net score value -21 this month. Health related products consumption increased more for rural segment of the consumers (33%) and among those with a monthly income of 31000 and above (about 37%).
  • Consumption of media (TV, Internet, Radio etc.) has increased for 24% of the families, depicting a significant increase by 3% from last month and highest in the last four months. The overall, net score which was at +2 last month is at +4 this month. Media viewership has increased more among males (25%) and among 18-25 YO which (35%) as compared to older age groups.
  • Mobility has increased for 8% of the families, which is an increase by 1% from last month. The overall mobility net indicator score, which was at +1 last month, is at +2 this month. Mobility is highest amongst the age group of 18-25YO at 12% as compared to other age groups.
Axis My India Image

On topics of current national interest:

  • According to the Axis My India Consumer Sentiment Survey, which encompassed a total consumer base of 9,567 individuals, the findings reveal varying opinions regarding the likelihood of India experiencing an economic recession in 2023. Among the respondents, 22% believe that India will witness a significant recession, while 19% anticipate it to some extent. On the other hand, 31% of the respondents expressed confidence that India will not face a recession, rest being unsure.
  • In response to the question regarding whether respondents have been affected by job cuts or layoffs, considering those who answered "Yes" to being involved in a private/corporate job, the survey findings revealed that 17% reported being affected to a great extent, while an additional 19% stated being affected to some extent. Conversely, the majority of respondents, comprising 64%, mentioned that they have not been affected by job cuts or layoffs. These results thus highlight that a substantial portion of respondents have remained unaffected by such circumstances.
  • The survey also threw light on the purchase plans for summer durable products such as air conditioners (AC) and refrigerators during the current summer season. It revealed that only 4% of the respondents have made a purchase, while 9% have plans to buy. In contrast, a significant majority of 86% expressed no intention to buy these products.
  • The survey further explored consumer affinity towards summer products like ice creams and beverages compared to the previous year. Among the respondents, 21% indicated consuming more of these products this summer as compared to last year. A large sum of these respondents are 18-25YO (33%). A majority of 51% reported consuming the same amount as last year, while 28% mentioned consuming lesser than the previous year.
  • Furthermore when asked about the frequency of using AI-related tools while working or studying at college, the survey revealed only a negligible percentage of respondents reported daily (1%), occasional (1%), or rare (1%) usage. In contrast, a substantial majority of participants either do not use AI tools at all (9%) or are unaware of their existence (88%). These results indicate a limited adoption and awareness of AI-related tools among the surveyed population, highlighting the need for increased education and exposure in this domain. Digging deep the survey further found that 28% of those who do use AI tools (daily, occasionally, and rarely) believe that it improves the efficiency and productivity of workplaces or educational institutions.
  • When considering the ways in which AI tools influence their work or studies, respondents who reported using AI tools daily, occasionally, or rarely provided the following insights: 6% found AI tools effective in answering queries compared to other sources, 22% appreciated their ability to reduce workload and save time, and 4% acknowledged AI tools' capability to perform simple tasks with minimal interference. However 2% expressed concerns about relying too heavily on AI, and 1% reported a perceived loss of critical thinking and decision-making skills. These responses highlight the varied impacts of AI tools, ranging from improved efficiency and time savings to concerns regarding overdependence and potential effects on cognitive abilities.
  • When asked about their beliefs regarding the potential for AI tools to replace human jobs in the future, respondents (excluding those who answered "Not aware”) respondents revealed a range of perspectives. 26% belief that AI tools do have the potential to replace human jobs. While 25% believe otherwise, a majority of such respondents were male (20%). Interestingly, 50% of respondents, acknowledged that only repetitive or routine tasks, which are susceptible to automation, will likely be replaced by AI tools. A majority of such respondents were male (51%).
  • When asked about the OTT platforms they surveyors have ever subscribed to, they provided a range of options. The top four OTT platforms mentioned include Hotstar (15%), Jio Cinema (12%), Amazon Prime (9%), and Netflix (5%). Other platforms mentioned by respondents include Zee5 (3%), Voot (1%), YouTube Premium (1%) and others (4%).
  • Comparing the responses from the previous question regarding ‘OTT platforms ever subscribed’ to with the ‘currently subscribed platforms’, the survey observed some variations. Among the respondents, the top four currently subscribed OTT platforms are Jio Cinema (14%), Hotstar (10%), Amazon Prime (7%), and Netflix (4%). It is interesting to note that the order of preference has shifted slightly, with Jio Cinema now being the most widely used platform, followed by the others. Some platforms, such as, Zee5 (2%), YouTube Premium (1%), and Voot (1%), have also experienced slight changes in their current preference ranking. These findings highlight the dynamic nature of OTT platform usage and reflect the evolving preferences of the respondents in terms of their current subscriptions.
  • Examining the responses to the question regarding future OTT platform subscriptions, some interesting patterns emerge. The top four platforms that respondents plan to continue using or subscribing to in the future are Amazon Prime (22%), Hotstar (22%), Jio Cinema (21%), and Netflix (12%). It is worth noting that while Amazon Prime and Hotstar maintain their positions, Jio Cinema has caught up with Netflix in terms of future subscription intent. Additionally, some platforms like Zee5 (6%), SonyLiv (2%), and others (13%) have garnered relatively higher interest for future subscriptions compared to their current or ever subscribed rates.
  • Regarding upcoming India vs Australia World Test Championship in June 2023, the survey revealed varying levels of interest among the respondents. 24% expressed their intention to watch the championship on TV, while 19% preferred to watch it on digital/mobile platforms. Additionally, 9% indicated their plan to enjoy the championship both on TV and mobile. Among those who prefer TV, the majority are above 60 years (31%), while the majority of those who prefer digital/mobile belong to the age group of 18-25YO (37%)
  • On rights of LGBTQ+ community, the survey delved into their opinions on granting equal marriage rights to same-sex couples. Among those aware, 57% firmly believed that the LGBTQ+ community should be afforded equal marriage rights as heterosexual couples. A majority of the responded who agreed to this view belonged to the age group of 18-25YO.
  • When asked about their awareness of the same-sex marriage issue fought at the high court, the survey revealed that 25% are aware of the issue while a majority of 75% responded negatively, indicating a lack of awareness regarding the same. Among respondents who indicated awareness of the same-sex marriage issue fought at the high court, the survey sought their opinion on whether the Supreme Court's decision to leave the matter to the parliament is the right choice. Of those respondents, 57% agreed that it is the right choice, indicating their support for the Supreme Court's decision. In contrast, 34% disagreed with the decision, expressing their belief that the Supreme Court should have taken a definitive stance on the issue.
May 23
  • Dream 11, Thums Up, Tata Neu, Jio captured more eyeballs during the IPL season as per Axis My India May CSI Survey
  • 10,206 people surveyed; 64% are from rural India while 36% are from urban India
  • Media consumption increased for 21%, highest amongst 18-25YO
  • 55% are watching IPL matches on TV, 45% on mobile
  • 6% have heard about ChatGPT, out of which 81% believe it is more of a boon than bane

National, 3rd May 2023: Axis My India, a leading consumer data intelligence company, released its latest findings of the India Consumer Sentiment Index (CSI), a monthly analysis of consumer perception on a wide range of issues. The May report highlights that media viewership has increased for a significant proportion of households, with males and younger age groups displaying higher consumption rates. With the IPL fever gripping the nation, the survey shows that cable/DTH television sets are the favoured mode of watching for the middle-aged population, while the younger demographic prefers mobile (Jio Cinema). The report also highlights the top brands that captured viewers' attention, with Dream11 & Thums Up securing the highest recall among viewers.he May net CSI score, calculated by percentage increase minus percentage decrease in sentiment, is at +09, which has increased by 1 point compared to last month.

The sentiment analysis: delves into five relevant sub-indices – Overall household spending, spending on essential and non-essential items, spending on healthcare, media consumption habits, entertainment & tourism trends.

The survey was carried out via Computer-Aided Telephonic Interviews with a sample size of 10,206 people across 35 states and UTs. 64% belonged to rural India, while 36% belonged to urban counterparts. In terms of regional spread, 26% belong to the Northern parts while 25% belong to the Eastern parts of India. Moreover, 29% and 19% belonged to Western and Southern parts of India respectively. 64% of the respondents were male, while 36% were female. In terms of the two majority sample groups, 32% reflect the age group 36YO to 50YO and 29% reflect the age group of 26YO to 35YO.

Commenting on the CSI report, Pradeep Gupta, Chairman & MD, Axis My India, said "Today's media landscape is evolving at a rapid pace, and our survey results highlight some intriguing trends that businesses and marketers should take note of. From a growing appetite for environmentally conscious products among young consumers, to the increasing popularity of mobile viewing during events like the IPL, to the rising interest in AI tools like ChatGPT, there are plenty of insights here for stakeholders across a range of industries. By paying attention to these shifts in consumer behavior, businesses can position themselves for success in the months and years ahead."

Key Findings On Media Consumption

  • This month Axis My India’s CSI survey threw light on the excitement around the sixteenth season of the Indian Premier League (IPL). It unveiled that 55% will watch the matches on their cable/DTH Television sets of which 61% are from urban counter cities. Moreover, 45% is expected to watch on mobile (Jio Cinema) of which 48% are from rural towns. While Mobile (Jio Cinema) is the preferred mode of watching for 18-25YO, (64%), cable/DTH Television sets are favoured by 36-50YO, (66%).
  • The survey also attempted to understand effectiveness of advertisement during IPL through consumer brand recall. Upon asking which brand ads have the IPL viewers noticed the most (Top of the Mind), the top brands mentioned were Dream 11, Thums Up, Tata Neu, Jio, PayTM, Amazon, LIC, Tata Tiago ev, Kamala Pasand, Kingfisher, TVS, Ceat, Rupay. However, Dream11 secured the maximum eyeballs (39%), followed by Thums Up (10%), Tata Neu (8%) and Jio (7%). Dream11, Tata Neu and Jio were recalled the most by male viewers.
  • Consumption of media (TV, Internet, Radio etc.) has increased for 21% of the families, which is an increase by 2% from last month. The overall, net score is at 2 this month. Media viewership has increased more among males (22%) and among 18-25 YO which (30%) as compared to older age groups.
Axis My India Image

On topics of current national interest:

  • The survey delved deeper to understand consumer investment plans for the new financial year. The survey revealed that a majority of 26% plans to park their funds in savings account while 20% plans to invest in their own business. Moreover, 16% wants to invest in Health insurance / Life Insurance while 13% wants to invest in real estate. 8% is looking to invest in FD & RD (Fixed Deposits and Recurring Deposits) and 7% in Gold. While the majority of the female (33%) have favoured Savings Account, a majority of males have chosen to invest in Business.
  • In an attempt to understand conscious purchase behaviour, the survey found out that 18% is willing to pay more than usual but less than 10% for environmentally friendly and sustainable products. While 11% is willing to pay 10-20% more only 6% can pay 20% more. This showcase a clear rise in the preference of conscious products driven by a sense of responsibility to make ethical and responsible choices. The findings also revealed that this behaviour resonates the most with 18-25YO, among men and those whose family monthly income is INR 31000 & above
  • Moreover, when asked on EV vehicle preferences, 11% said that they plan to buy a 2-wheeler and 6% said that they plan to buy a 4-wheeler. Among those surveyed majority of the urban dwellers (12%) display preference for two Wheeler EVs. Various government schemes coupled with lower operating and maintenance cost has pushed consumers towards adopting Electric Vehicle in India
  • The survey further deep dived to understand consumer’s perception on the education infrastructure in India. Of those surveyed, 51% said that their children go to Government schools and 57% said theirs go to Private schools. 56% of rural India are going to Government schools and 57% of urban India are going to Private schools. Only 1% said their children go to International schools. Additionally, 82% of those whose children go to Private or International schools are positive about sending their children to Government schools if it assures superior facilities and quality education.
  • Finally, the survey wanted to gauge consumer’s interaction with new AI tools like ChatGPT and their perception on its efficiency. Of those surveyed (NCCS AB, Graduates & above) 6% have heard about ChatGPT. Importantly, 81% of those that have heard view the AI tool as an advantage to their work while a combined 24% views it as an obstacle to job security and data reliability. A majority of those who have heard about the AI tool and views it as an advantage belongs to the age group of 18-25YO.
Apr 23
  • (Retail) 15% consumers plan to buy white goods such as AC, Refrigerator this summer season- as per Axis My India April CSI Survey
  • Overall household spending has increased for 56%
  • (A&M) 57% prefer watching IPL on TV, 30% on mobile: Axis My India April CSI Survey
  • Overall 42% plan to watch IPL 2023 season
  • (General Interest/HR) 50% say more job opportunities in India today than 10 Years Ago: Axis My India April Survey
  • 35% parents wants children to choose their own career
  • 10,034 people surveyed; 66% are from rural India while 34% are from urban India
  • Overall household spending up for 56%, highest from Telangana and Andhra Pradesh
  • Consumption of essentials products up for 33%, highest from Karnataka and Tamil Nadu
  • Media consumption increased for 19%, highest amongst 18-25YO
  • 51% of youngsters (18-25YO) want to watch IPL matches
  • 32% from rural areas show more interest in watching IPL on Mobile
  • Overall 15% plans to buy durables like AC or Refrigerators in the next 2-3 months
  • 23% plans for a domestic holiday
  • 52% considers product quality and 33% considers brand name as important factors for product purchases
  • Overall 30% are influenced by ads featuring celebrities
  • 50% believe that there are more employment opportunities as compared to last 10 years
  • 25% would prefer their children to enrol in the Govt service

(Retail + General Interest + HR) National, 3rd April 2023: Axis My India, a leading consumer data intelligence company, released its latest findings of the India Consumer Sentiment Index (CSI), a monthly analysis of consumer perception on a wide range of issues. The April report reveals that household spending has increased for a majority of families in the country with Andhra Pradesh and Telangana leading the way. While essential spends increased more for rural segments, non-essential/discretionary spends remained the same as last month. However, with the summer season approaching, a surge in interest in buying white goods in the next few months is expected. The survey also revealed that product quality and brand name are key factors influencing product purchase decisions, with celebrities featuring in advertisements also influencing buying decisions to some extent. The enthusiasm for IPL is expected to increase further, with both TV & mobile contributing to viewership.

(A&M) National, 3rdApril 2023: Axis My India, a leading consumer data intelligence company, released its latest findings of the India Consumer Sentiment Index (CSI), a monthly analysis of consumer perception on a wide range of issues. The April report highlights that 19% of families have reported a rise in media consumption. Moreover, the survey reveals that urban areas and male viewers are leading the surge in media viewership. The enthusiasm for IPL is expected to increase further, with both TV & mobile contributing to viewership. The study also delved into the key factors that influence consumers' buying decisions, revealing that product quality and brand name remain important considerations. Additionally, the survey sheds light on the role of celebrity endorsements in driving product purchases, with younger age groups being more susceptible to their influence.

The April net CSI score, calculated by percentage increase minus percentage decrease in sentiment, is at +8, which is the same as last month. The corresponding net score last year was +11. The sentiment analysis delves into five relevant sub-indices – Overall household spending, spending on essential and non-essential items, spending on healthcare, media consumption habits, entertainment & tourism trends.

The survey was carried out via Computer-Aided Telephonic Interviews with a sample size of 10,034 people across 33 states and UTs. 66% belonged to rural India, while 34% belonged to urban counterparts. In terms of regional spread, 25% belong to the Northern parts while 26% belong to the Eastern parts of India. Moreover, 28% and 21% belonged to Western and Southern parts of India respectively. 63% of the respondents were male, while 37% were female. In terms of the two majority sample groups,29% reflect the age group 36YO to 50YO and 29% reflect the age group of 26YO to 35YO.

(Retail, General Interest + HR) Commenting on the CSI report, Pradeep Gupta, Chairman & MD, Axis My India, said “Despite a dip in consumer sentiment last year, the upcoming summer season is expected to see an increase in purchases of white goods such as air conditioners and refrigerators. However, there is still an overall sense of restraint or reduction in sentiment across indices. On a positive note, the younger generation shows promise as per the survey findings, with a slight increase in mobility suggesting a more outgoing nature. Furthermore, with more job opportunities available, this segment remains optimistic about their future. Additionally, with 30% of youngsters planning domestic holidays, there is potential for an increase in travel-related sales. These insights provide valuable information for marketers to strategize their efforts by focusing on consumer needs and preferences."

(A&M) Commenting on the CSI report, Pradeep Gupta, Chairman & MD, Axis My India, said "Closely examining the findings of our latest survey, it is clear that media consumption habits are not uniform across demographics, with variations emerging among different age and gender groups. It is noteworthy that younger age groups are showing a greater appetite for media consumption, with a particular interest in watching the Indian Premier League. Digital is expected to contribute significantly to the rise of IPL viewership. As we delve deeper into consumer behaviour, it is evident that product quality and brand name remain key considerations, but we are also seeing a significant impact of celebrity endorsements on purchasing decisions, especially among younger age groups. These insights highlight the need for brands to stay attuned to the evolving consumer preferences and tailor their marketing strategies accordingly to drive engagement and enhance customer loyalty."

Key Findings

  • Overall household spending has increased for 56% of the families, this reflects a decrease of 2% from last month and 6% from April’22. The net score, which was +51 last month and +53 in April’22 has reduced to +49 this month. The two states, which reflected the highest increase, are Telangana with 70%, followed by Andhra Pradesh with 66%. The age group between 26-50 showcased the highest increase (58%).
  • Spends on essentials like personal care & household items has increased for 33% of the families, which reflects a dip by 3% from last month and 15% from April’22. The net score, which was at +23 last month and +29 in April’22, has decreased to +21 this month. Essential spends has increased more for rural segment (33%) as compared to the urban counterparts (31%). Karnataka and Tamil Nadu reflects the highest essential spends with 50% and 49% respectively. The age group between 36-50 showcased the highest increase (36%).
  • Spends on non-essential & discretionary products like AC, Car, and Refrigerator have increased for 4% of families, which is the same as last month and reflects a dip by 9% from April’22. The net score, which was at 0 last month, remains the same.
  • Expenses towards health-related items such as vitamins, tests, healthy food has surged for 32% of the families. This reflects a decrease in consumption by 3% from last month and 6% from April’22. The health score which has a negative connotation i.e., the lesser the spends on health items the better the sentiments, has a net score value -22 this month. Health related products consumption increased more in rural areas (33%) and among age group of 26-35 (about 34%). Karnataka with 49% and Bihar with 43% reflect the highest spends in health-related products.
  • Consumption of media (TV, Internet, Radio etc.) has increased for 19% of the families, which is the same as last month and reflects a dip by 3% from April’22. The overall, net score is at 0 this month. Media viewership has increased more in urban areas (21%) and among males (20%) while it is only 17% among females. In addition, media consumption is more among 18-25 YO which (29%) as compared to older age groups.
  • Mobility has increased for 6% of the families, which reflects a decrease by 1% from last month and same as April’22. The overall mobility net indicator score, which was at 0 last month, is at -1 this month. 10% of the youngsters from the age group of 18-25, has gone out more in the last month as compared to other age groups.

On topics of current national interest:

  • This month Axis My India’s CSI survey highlighted that with summers approaching, 15% of those surveyed plans to buy durables like AC or Refrigerators in the next 2-3 months. Moreover 19% of youngsters (18-25 YO), highest amongst all age groups are considering to buy durables like AC, fridge etc. this summer season.
  • The survey also threw light on consumer travel plans this summer season. Overall 24% plans to travel of which 23% said they are planning for a domestic holiday while 1% is planning for an international vacation. Plans of travel is higher in the younger age group of 18-25 years at 30%.
  • In an attempt to understand product purchase behaviour, the survey found out that 52% considers product quality and 33% considers brand name as important factors. 60% of 18-25YO puts weightage on the product quality whereas 35% of 36-50YO considers brand name as important factors. Price is overall considered as the third most important factor with a vote of only 22%.
  • The survey also unveiled that advertisement in which celebrities feature, influence product buying decisions of 30% to some extent. Of this, about 35% of them are youngsters (of age 18-25) and 27% are middle-old and older age group
  • On employment opportunities the survey revealed that 50% believe that there are more openings/opportunities as compared to last 10 years. 53% of the female population have a positive outlook regarding the same highlighting the raise in the number of jobs available for the gender. In addition, younger age group (18-25YO) also thinks job opportunities have increased overtime.
  • Moreover, the survey discovered that among the top professions in the country 25% would prefer their children to enrol in the Govt service, 16% would prefer them to be in medical profession while 10% would prefer them to work in fields related to Engineering, Computer application, IT. A majority of 35% are of the view that their children should do whatever they want to do.
  • The survey further deep dived to understand citizens’ sentiments towards the 16th edition of Indian Premier League. 42% would watch IPL this season, out of this 19% would watch all the matches whereas 22% would only watch matches where their ‘favourite’ teams will play or critical matches like eliminators and finals. About 26% of youngsters (18-25YO) wants to watch all the matches as compared to older age group highlighting their younger spirit and interest in IPL. In addition, male viewers and urban areas show more interest in watching the tournament.
  • Further investigating sentiments, the study discovered that 57% would watch the matches only on cable/DTH Television sets while 30% will watch it only on mobile – Jio Cinema. 8% said they would watch on both TV and mobile. 3% plans to watch the tournament physically from the stadium. About 32% from rural areas show more interest in watching IPL on mobile given the free telecast of IPL matches. Middle age groups, of 26-50 YO would prefer watching more on television than younger age groups.
Mar 23
  • 43% believe that Sensex will go beyond 70,000 in the next 3 months - as per Axis My India March CSI Survey 52% rated 2023 Union Budget as satisfactory
  • 10124 people surveyed; 65% are from rural India while 35% are from urban India
  • Overall household spending has increased for 58%, net score +51
  • Consumption of essentials products increased for 36%, net score +23
  • Consumption of discretionary products increased for 4%, net score 0
  • Consumption of health-related items has increased for 35%, net score -24
  • Media consumption increased for 19%, net score -1
  • Mobility has increased for 7% of the families, net score 0
  • 52% rated 2023 Union Budget presented by Finance Minister as satisfactory
  • 72% believe that Indian economy would continue to grow in 2023
  • 43% believe that sensex will go beyond 70,000 in the next 3 months
  • 72% think PM Narendra Modi is India’s most influential person, next is Rahul Gandhi at 5%
  • Covid management (16%), infrastructure development (14%), and welfare schemes (11%) key achievements of the BJP government
  • 29% spend 1-3hrs on watching content on OTT platforms & 8% spend more than 3 hrs
  • 24% share their OTT passwords with their friends & family

Axis My India, a leading consumer data intelligence company, released its latest findings of the India Consumer Sentiment Index (CSI), a monthly analysis of consumer perception on a wide range of issues. The survey further highlighted that sentiments have dipped across 4 out of 5 sub-indices, importantly, sentiments have slightly dropped towards essential and non-essential spends. However, the March report reveals that consumer outlook are positive towards the 2023 Budget announcement presented by Finance Minister Nirmala Sitharaman and overall, the Indian consumer sentiment is optimistic that the country's economy will continue to grow at an accelerated rate in 2023, owing to the country's robust fight against all obstacles in the previous year. 72% think PM Narendra Modi is India’s most influential person and Covid management, infrastructure development, and welfare schemes were the key achievements of the BJP government.

The March net CSI score, calculated by percentage increase minus percentage decrease in sentiment, is at +8, from +10 last month reflecting a decrease by 2 points.

The sentiment analysis delves into five relevant sub-indices – Overall household spending, spending on essential and non-essential items, spending on healthcare, media consumption habits, entertainment & tourism trends.

The survey was carried out via Computer-Aided Telephonic Interviews with a sample size of 10124 people across 36 states and UTs. 65% belonged to rural India, while 35% belonged to urban counterparts. In terms of regional spread, 26% belong to the Northern parts while 30% belong to the Eastern parts of India. Moreover, 24% and 20% belonged to Western and Southern parts of India respectively. 67% of the respondents were male, while 33% were female. In terms of the two majority sample groups, 31% reflect the age group 36YO to 50YO

Commenting on the CSI report, Pradeep Gupta, Chairman & MD, Axis My India, said "The Indian Budget 2023 focused on reviving the economy, which was impacted by the COVID-19 pandemic and various other obstacles. The government announced various measures for citizens’ financial empowerment and improved standard of living. This was highly appreciated across the country. PM Modi being rated as the most influential person in India by far is no surprise. At an overall level, while consumer sentiments are subdued, it is expected to revive soon, driven by various factors such as improving economic conditions, growing consumer confidence, and changing consumer behavior. Moreover increasing adoption of e-commerce and digital payments, is likely to drive consumer spending in the near future."

Key Findings

  • Overall household spending has increased for 58% of families, decrease by 1% from last month. The net score, which was +52 last month has decreased by 1 to +51 this month.
  • Spends on essentials like personal care & household items has increased for 36% of the families, which reflects a dip by 4% from last month. The net score, which was at +29 last month, has decreased by 6 to +23 this month.
  • Spends on non-essential & discretionary products like AC, Car, and Refrigerator has increased for 4% of families, which reflects a decrease by 1% from last month. The net score, which was at +1 last month, is at 0 this month. Sentiment towards discretionary spending has steadily decreased over the last four months.
  • Expenses towards health-related items such as vitamins, tests, healthy food has surged for 35% of the families. This reflects an increase in consumption by 2% from last month. The health score which has a negative connotation i.e., the lesser the spends on health items the better the sentiments, has a net score value -24 this month.
  • Consumption of media (TV, Internet, Radio etc.) has increased for 19% of the families, which reflects a decrease by 1% from last month. The overall, net score, which was at 0 last month, is at -1 this month
  • Mobility has increased for 7% of the families, which reflects an decrease by 2% from last month. The overall mobility net indicator score, which was at +2 last month, is at 0 this month.

On topics of current national interest:

  • Axis My India CSI survey deep dived to understand citizens’ sentiments towards the 2023 Union Budget. The survey found out that 52% were pleased with the announcement, which sets out on a quest to fulfill the dreams of the corporates, farmers, and the middle class. However, 29% rated the budget unsatisfactory and only 10% had a neutral stance towards it.
  • Further investigating sentiments, the study discovered that 72% believe that Indian economy would continue to grow in 2023 in comparison to previous year. The optimism stems from the country’s superior performance in dealing with unprecedented obstacles such as Covid, the Russia-Ukraine war, control of inflation as compared to other nations.
  • The survey also highlighted that 43% believe that Sensex will go beyond 70,000 in the next three months. Whereas 25% believe that, it will remain between 55,000 to 65,000. Additionally, 18% believe that it will drop below 50,000.
  • As we move towards the 2024 Lok Sabha elections, Axis My India Consumer Sentiment Survey also attempted to understand the BJP’s (Bharatiya Janata Party) contributions towards the country. Basis the same, the survey revealed that handling Covid (16%), infrastructure development (14%), and welfare schemes (11%) have been some of the key achievements of the current BJP government. The survey also discovered that 72% believe Prime Minister Narendra Modi to be India’s most influential person, followed by Rahul Gandhi at 5%, Mukesh Ambani at 4% and Yogi Adityanath at 3%.
  • The survey also threw light on the OTT (Over-the-top) viewing behavior of viewers:
    • -> 29% spend 1-3hrs on watching content on OTT platforms, while 26% spend upto 30 minutes on OTT platforms. 23% watch content for 31mins-1hr and interestingly there are 8% who watch it for more than 3 hours.
    • -> Moreover, the survey also discovered that 24% share their OTT passwords with their friends & family.
Feb 23
  • 73% expect reduction in prices of essential items from Budget 2023- as per Axis My India Pre-Budget CSI Survey
  • 6100 people surveyed; 65% are from rural India while 35% are from urban India
  • 26% wants lower personal income tax rates by 5% across all slabs
  • Overall household spending has increased for 59%, net score +52
  • Consumption of essentials products increased for 40%, net score +28
  • Consumption of discretionary products increased for 5%, net score +1
  • Consumption of health-related items has increased for 33%, net score -22
  • Mobility has increased for 7% of the families, up by 1% for last month
  • 38% notice brand advertisements on TV while 32% notice ads on digital medium
  • Media consumption increased for 20%
  • Mobility has increased for 9% of the families, net score +2

Mumbai, 30th January 2023: Axis My India, a leading consumer data intelligence company, released its latest findings of the India Consumer Sentiment Index (CSI), a monthly analysis of consumer perception on a wide range of issues. The pre-budget report highlighted that reduction in price of essentials is the biggest expectation from the 2023 budget. One of the major requests which comes out in this survey is reduction in income tax rates, which will give consumers more money in hand.

The Pre-Budget net CSI score, calculated by percentage increase minus percentage decrease in sentiment, is at +10, from +08 last month reflecting an increase by 02 points.

The sentiment analysis delves into five relevant sub-indices – Overall household spending, spending on essential and non-essential items, spending on healthcare, media consumption habits, entertainment & tourism trends.

The survey was carried out via Computer-Aided Telephonic Interviews with a sample size of 6100 people across 27 states and UTs. 65% belonged to rural India, while 35% belonged to urban counterparts. In terms of regional spread, 23% belong to the Northern parts while 27% belong to the Eastern parts of India. Moreover, 28% and 22% belonged to Western and Southern parts of India respectively. 69% of the respondents were male, while 31% were female. In terms of the two majority sample groups, 33% reflect the age group 36YO to 50YO and 30% reflect the age group of 26YO to 35YO.

Commenting on the CSI report, Pradeep Gupta, Chairman & MD, Axis My India, said “Consumers are looking forward to the upcoming budget announcements as a ray of hope for better life and livelihood and there is a huge expectation in terms of price control. Consumers are also looking forward towards various measures that the government will take towards fuelling digitization in the Indian economy. Overall, despite global headwinds the Indian economy should be poised for further growth in 2023”.

Key Findings

  • Overall household spending has increased for 59% of families, increased by 4% compared to last month. The net score, which was +47, last month has increased by 5 to +52 this month.
  • Spends on essentials like personal care & household items has increased for 40% of the families, which reflects a dip by 1% from last month. The net score, which was at +26 last month, increased by two at +28 this month.
  • Spends on non-essential & discretionary products like AC, Car, and Refrigerator has increased for 5% of families, which reflects a decrease by 2% from last month. The net score, which was at +2 last month, has reduced to +1 this month. Sentiment towards discretionary spends highlight the lowest percentage increase in the last four months.
  • Expenses towards health-related items such as vitamins, tests, healthy food has surged for 33% of the families. This reflects a decrease in consumption by 6% from last month. The health score which has a negative connotation i.e., the lesser the spends on health items the better the sentiments, had a net score value of -28 last month, is at -22 this month. Sentiment towards health spends also showcase the lowest percentage increase in the last four months.
  • Consumption of media (TV, Internet, Radio etc.) has increased for 20% of the families, which reflects a decrease by 1% from last four months where it has been consistent at 21%. The overall, net score, which was at -2 last month, reflects 0 this month.
  • Mobility has increased for 9% of the families, which reflects an increase by 2% from last month. The overall mobility net indicator score, which was at +2 last month, has remained the same this month.

On topics of current national interest:

  • Deep diving deeper to understand citizens’ sentiments towards the Indian economy, the survey found out that 22% consider ‘oil prices’ to significantly impact the Indian economy this year. Moreover 16% each consider ‘inflation’ and ‘upcoming 2024 elections’ to also have a bearing this year on the economy. Government policies and Russia-Ukraine war continue to be the concern for 14% and 11% respectively.
  • The CSI survey also attempted to demystify consumer expectations from the budget. It revealed top issues that the upcoming budget needs to address:
    • - A majority of 73% feels that the budget needs to address ‘reduction in prices of essential items like soap, detergent, cooking oil’.
    • - 54% believe that it should also look into GST exemption on essential items
    • - 44% wants reduction in GST % &
    • - 32% wants housing loan exemption limits to be re-looked at
  • The survey also highlighted that 26% believe that Finance Minister should lower personal income tax rates in the upcoming budget by 5%. In addition, 25% wants the exemption limit to be raised beyond 2.5 lacs.
  • The survey also threw light on factors that will help digitization in the Indian economy. Better banking network (view of 32%), better spread of telecom connectivity & 5G (view of 19%) and better Internet security (view of 18%) are considered important pillars of digitization.
  • According to Axis My India’s Survey 38% notice brand advertisements on TV while 32% notice ads on digital medium. In addition of those surveyed 51% have noticed advertisements atleast once (or more) on digital medium.

Pre-Budget CSI Survey Index

Factors which will significantly impact the Indian economy this year?

Option Percentage (%)
Oil prices 22
Inflation 16
Upcoming 2024 elections 16
Government policies 14
Russia-Ukraine war 11
Unemployment 5
Impact of other global economies like US, Europe, Japan 3
Covid-19 2
Other 5

Expectations from the upcoming budget?

Option Percentage (%)
Reduction in prices of essential items like Soap, Detergent, Cooking Oil 73
GST exemption on essential items 54
Reduction in GST % 44
Relook housing loan interest repayment exemption 32
Lower personal Income Tax rates & surcharge reductions 28
Longer tax breaks & sops for start ups 27
Reduction in prices of discretionary/luxury items like Mobile Phone, Automobiles, Jewellery 21
Lower corporate tax 8
Change in long term capital gains tax exemption 7
Increase in the limit for deductions available under section 80 4

Need to re-look at personal income tax rates in the coming Budget?

Option Percentage (%)
Yes, reduction by 5% 26
Yes, the exemption limit should be raised beyond 2.5 lacs 25
Yes, bring back the standard deduction 16
Exemption by 30% across all slabs 2
Exemption by 1-3 lacs across all slabs 1
No 11
Don’t know/Can't Say 13